Worst Performers of the Week Analysis - ICON, Algorand, Cosmos, 0x and Basic Attention Token
4y ago
bullish:
4
bearish:
4
Share
Bitcoin saw a troublesome week in which it plummeted by a total of around 11%. The coin was trading near the $12,000 region at the start of September and has since dropped to the current $10,280 level. As expected, this has put some downward pressure on the majority of altcoins, some of which have suffered major drops this week.
Instead of presenting the top 5 strongest performers as we usually do, we felt it best to show you the top 5 worst performing altcoins this week, and see where they might find support and reverse. The five coins we will look at today are ICX (-33%), ALGO (-32.6%), ATOM (-32.%), ZRX(-30%), and BAT (-29.50%).
1. Icon
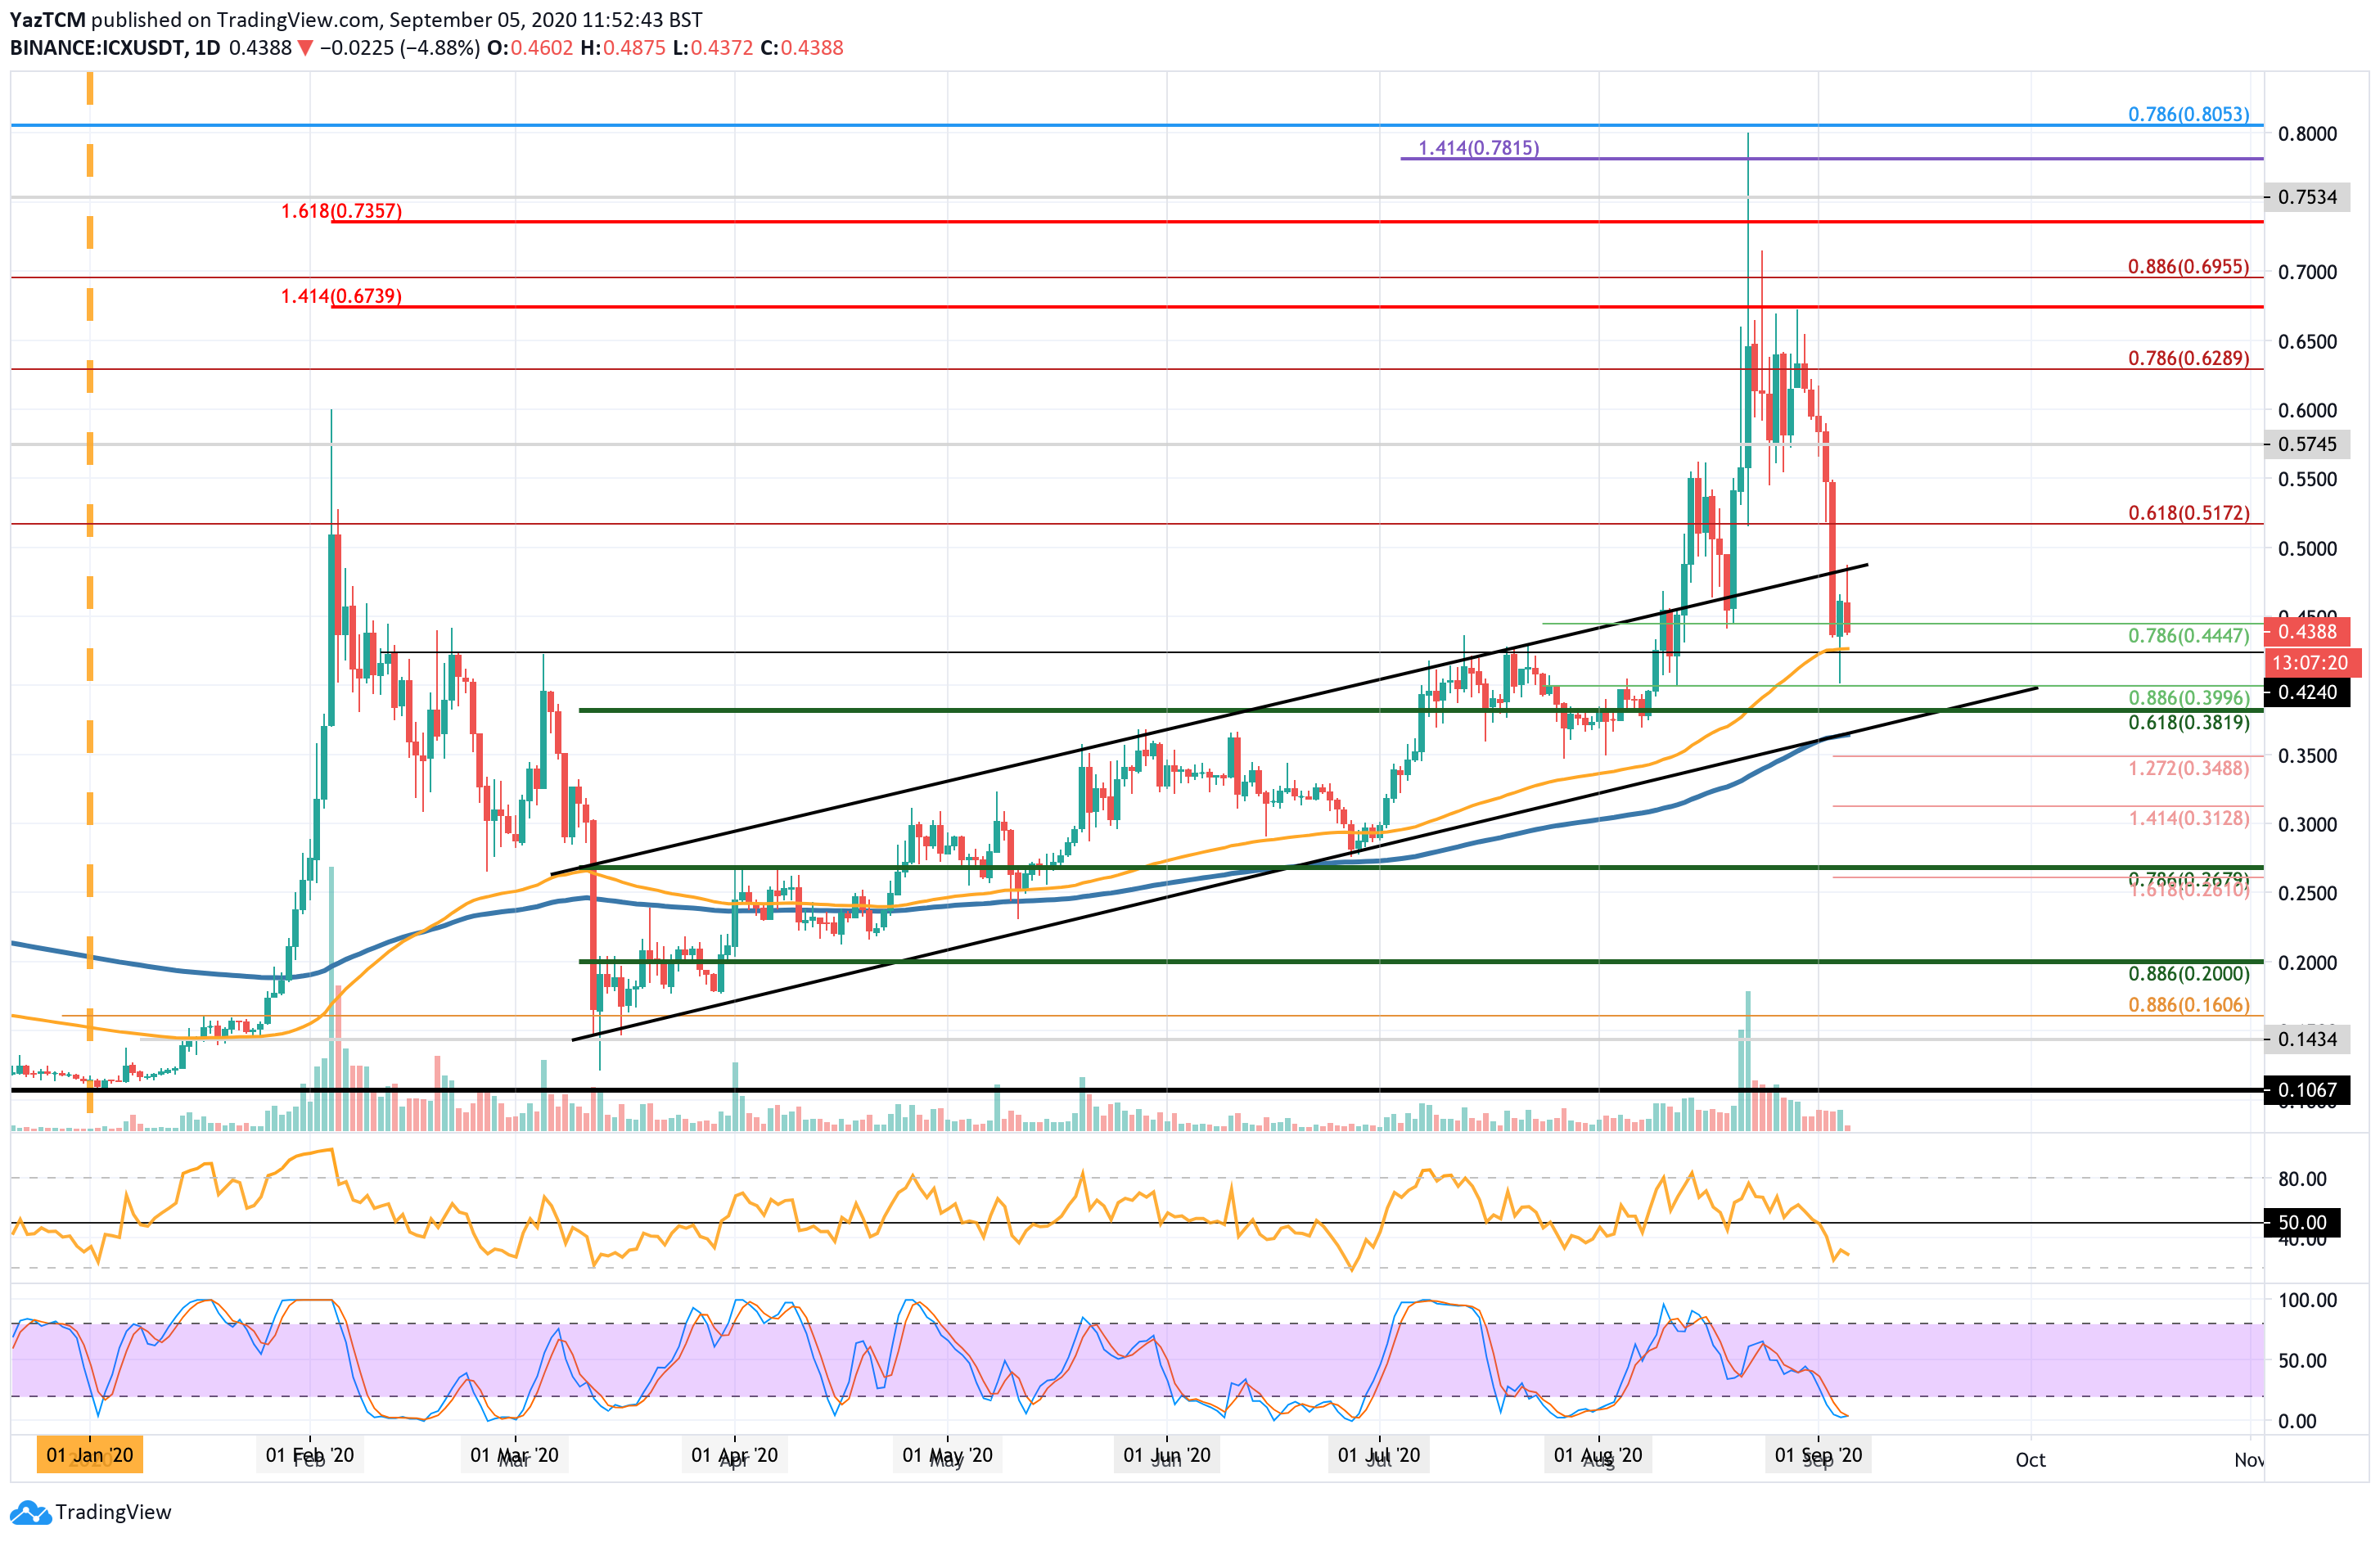
ICX dropped by a total of 33% this week as the coin hit the $0.3288 level. The coin had drenched resistance at around $0.65 during late August and it started to trend downward from that point onward.
In September, we can see that ICX was trading at around $0.6 as it started to slip. It continued to fall until support was found at the $0.4 support, provided by a .886 Fib Retracement level).
The recent price drops have now caused ALGO to fall back into an ascending price channel that it was trading within since March.
Looking ahead, if the sellers continue to push lower, the first level of support lies at $0.4240 (100-day EMA(, This is followed by support at $0.4 *.886 Fib Retracement), $0.3820 (longer-term .618 FIb Retracemnet), and then the lower boundary of the price channel. Interestingly, the 200-day EMA is also bolstering the support at the lower boundary of this channel.
Beneath the channel, added support is found at $0.35, $0.33, $0.312 (downside 1.414 Fib Extension), and $0.3.
On the other side, resistance lies at the upper boundary of the price channel, $0.5, $0.517, and $0.574.
2. Algorand
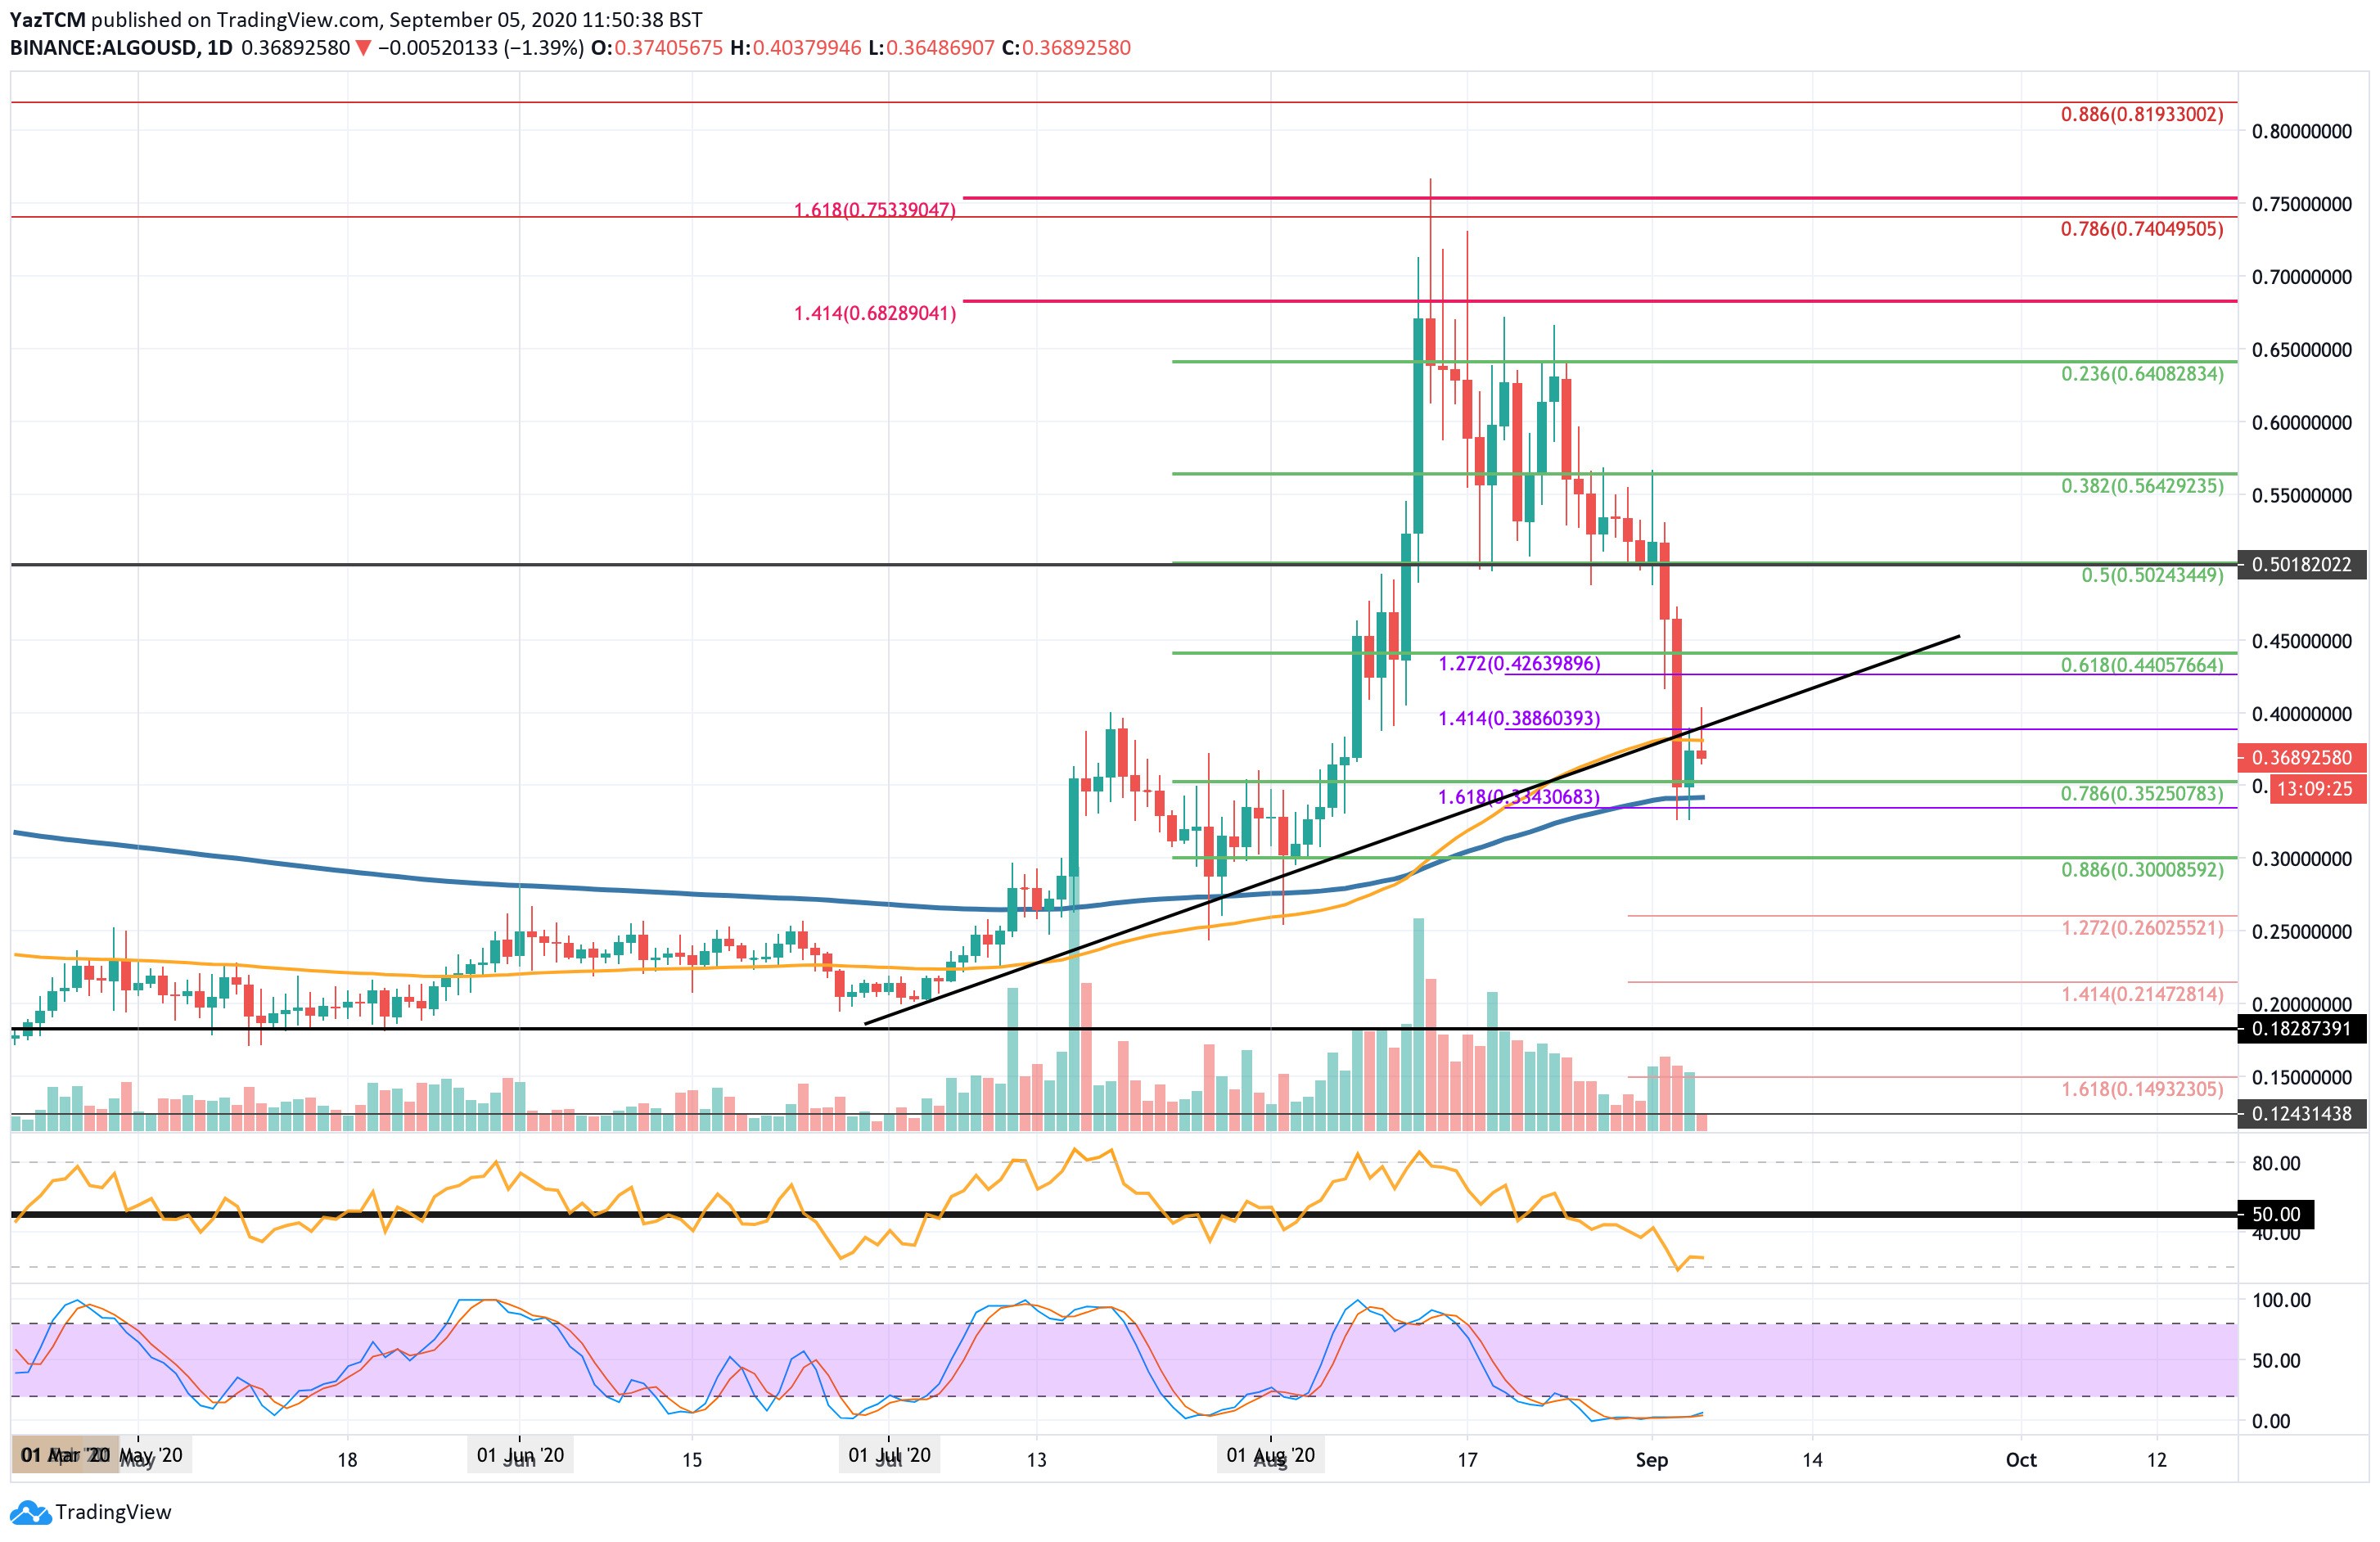
ALGO fell by 32.6% over the course of the past week as the coin hits the $0.368 level. ALGO was already falling toward the end of August after it hit a high of around $0.76. In September, it fell lower from $0.55 and continued to plummet until support was found at the .786 Fib Retracement at $0.352.
The latest price drops have caused ALGO to drop beneath a 2-month rising trend line as it now trades between the 100-day EMA and the 200-day EMA.
If the sellers push lower, support lies at $0.352, $0.334 (200-day EMA), and $0.30 (.886 Fib Retracement). Added support is found at $0.26, $0.25, and $0.214.
On the other side, resistance lies at $0.388. This is followed by resistance at $0.4, $0.426, $0.45, and $0.5.
3. Cosmos
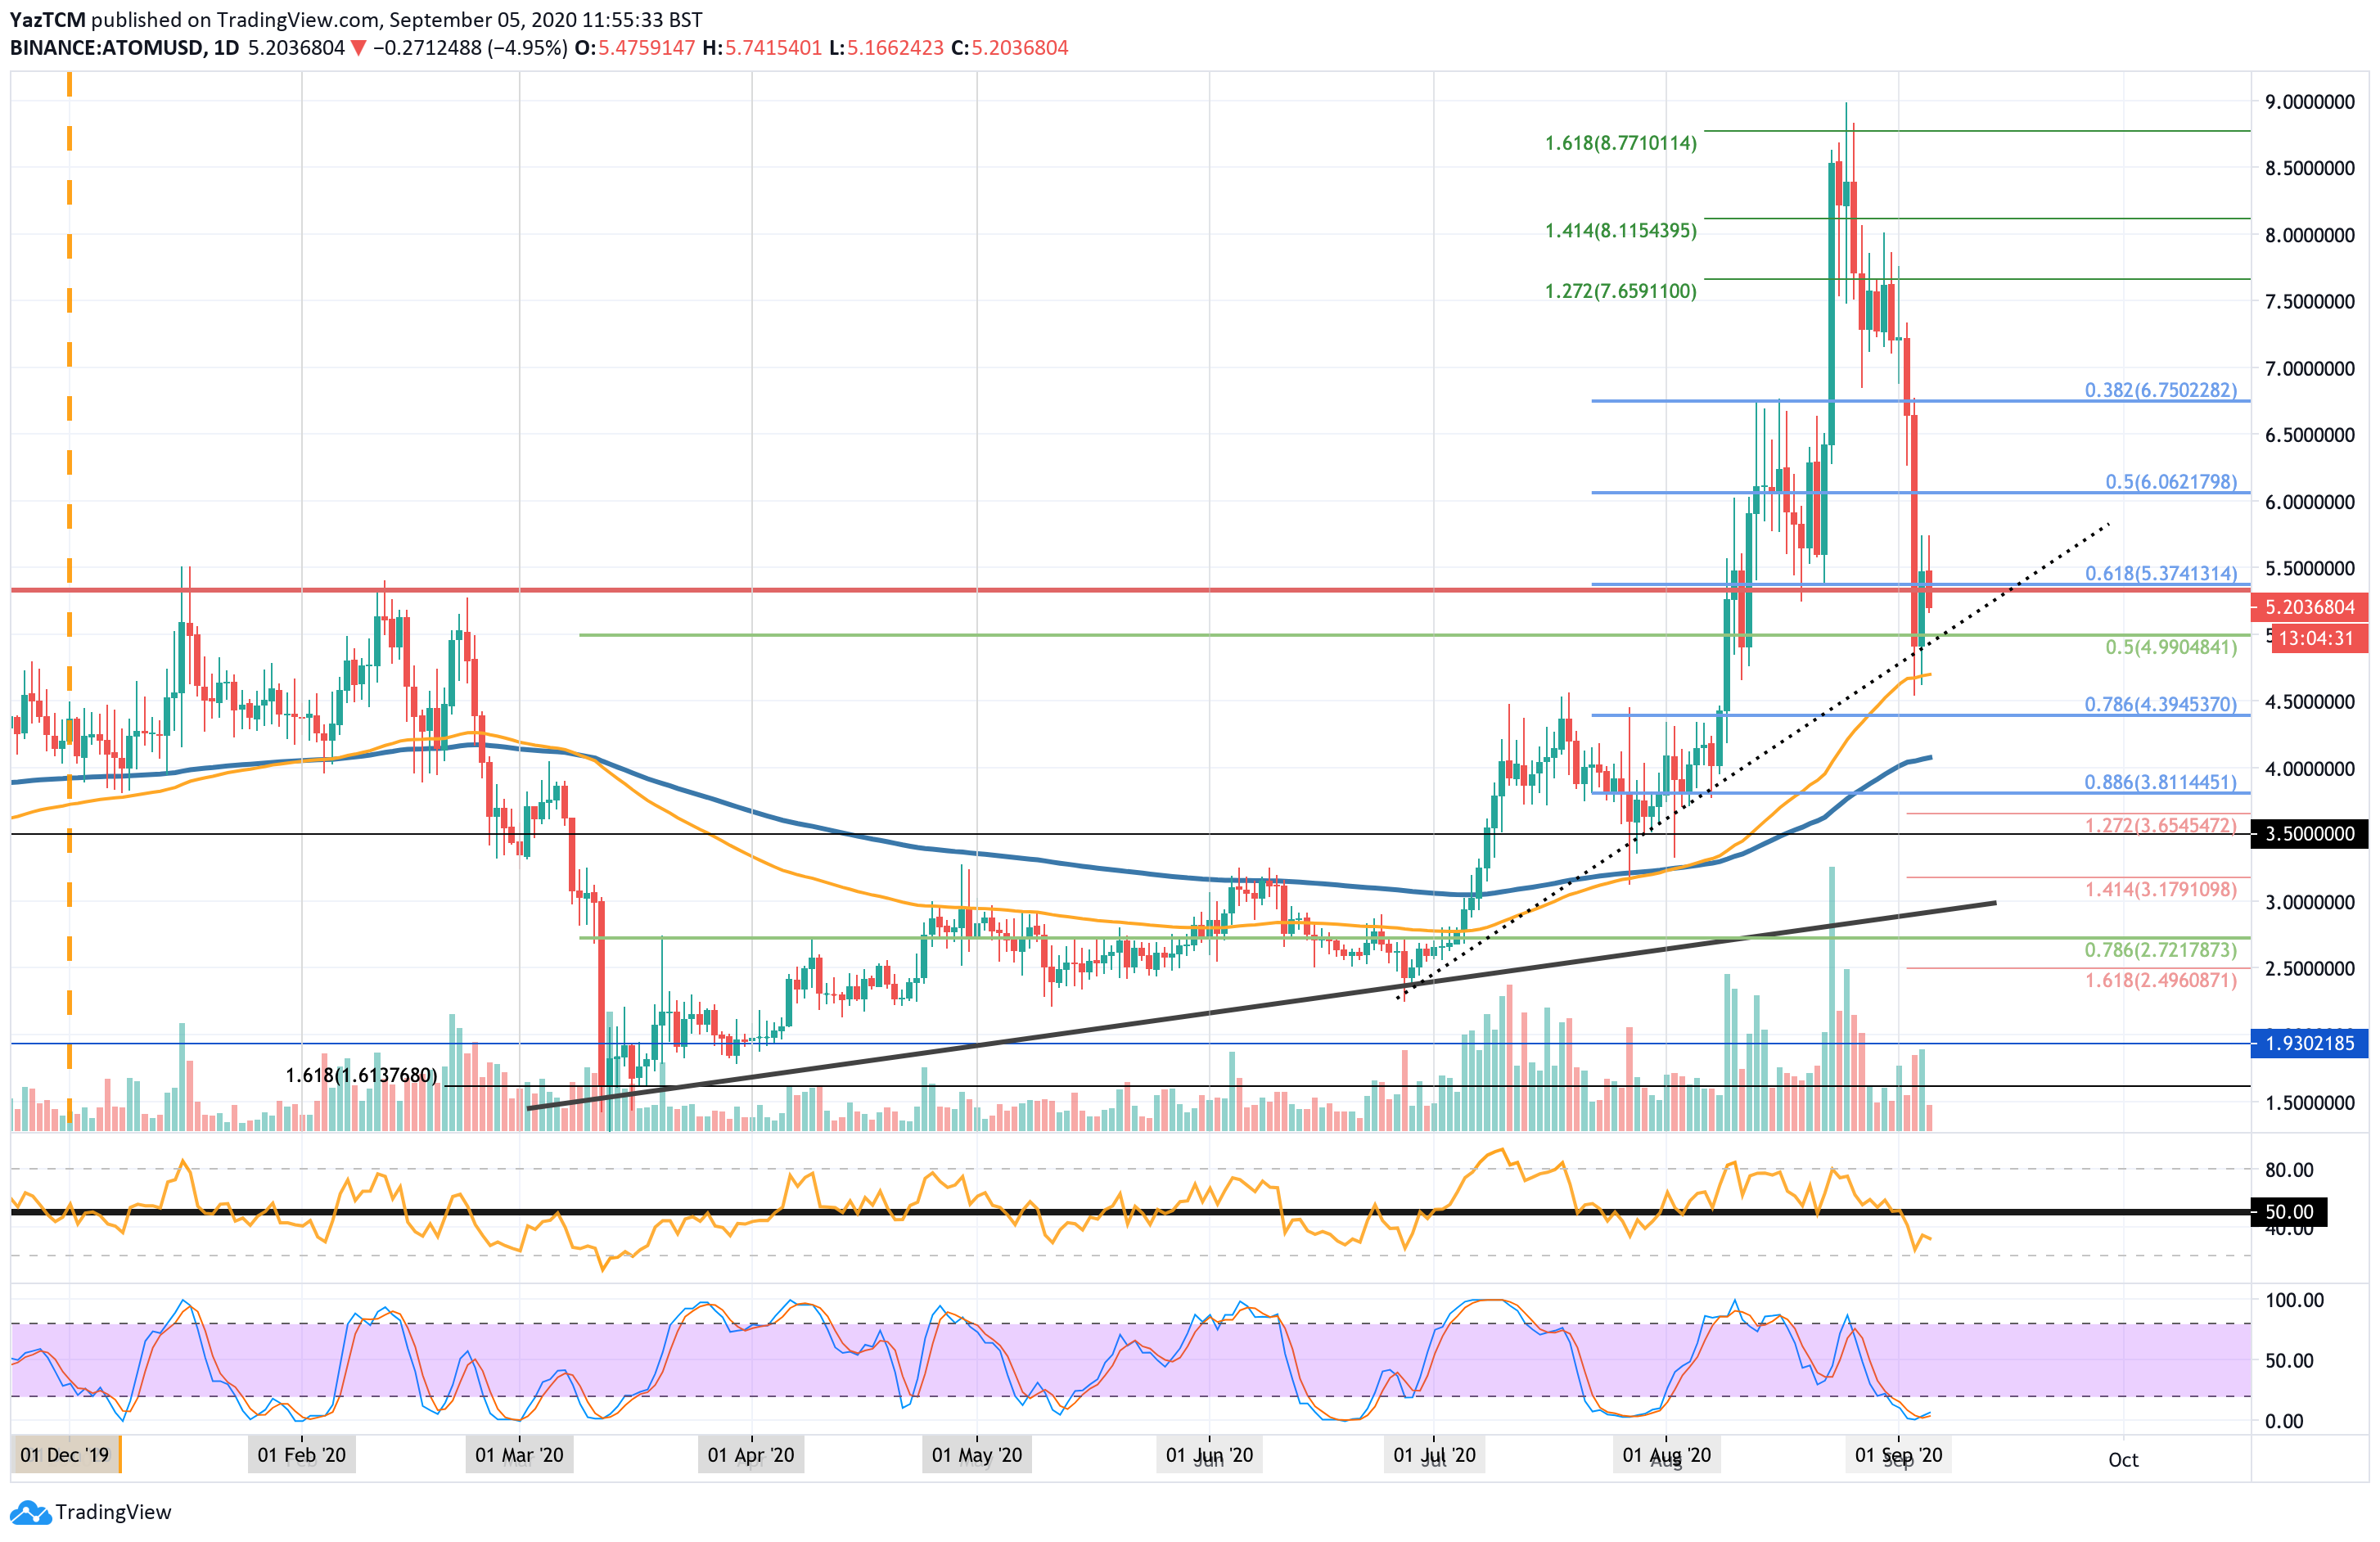
ATOM dropped by a steep 32% this week as the coin reached the $5.20 level. The coin started September at around $7.30 and continued to head lower from there. We can see that it continued to drop until finding support at a rising trend line, which allowed it to rebound.
Looking ahead, if the sellers push ATOM beneath $5.00 which is support from the rising trend line, added support lies at $4.70 (100-day EMA), $4.40 (.786 Fib Retracement), and $4.00 (200-day EMA).
Added support lies at $3.81 (.886 Fib Retracement), $3.65 (downside 1.272 Fib Extension), and $3.50.
On the other side, resistance is expected at $5.50, $6.00, and $6.50.
4. 0x
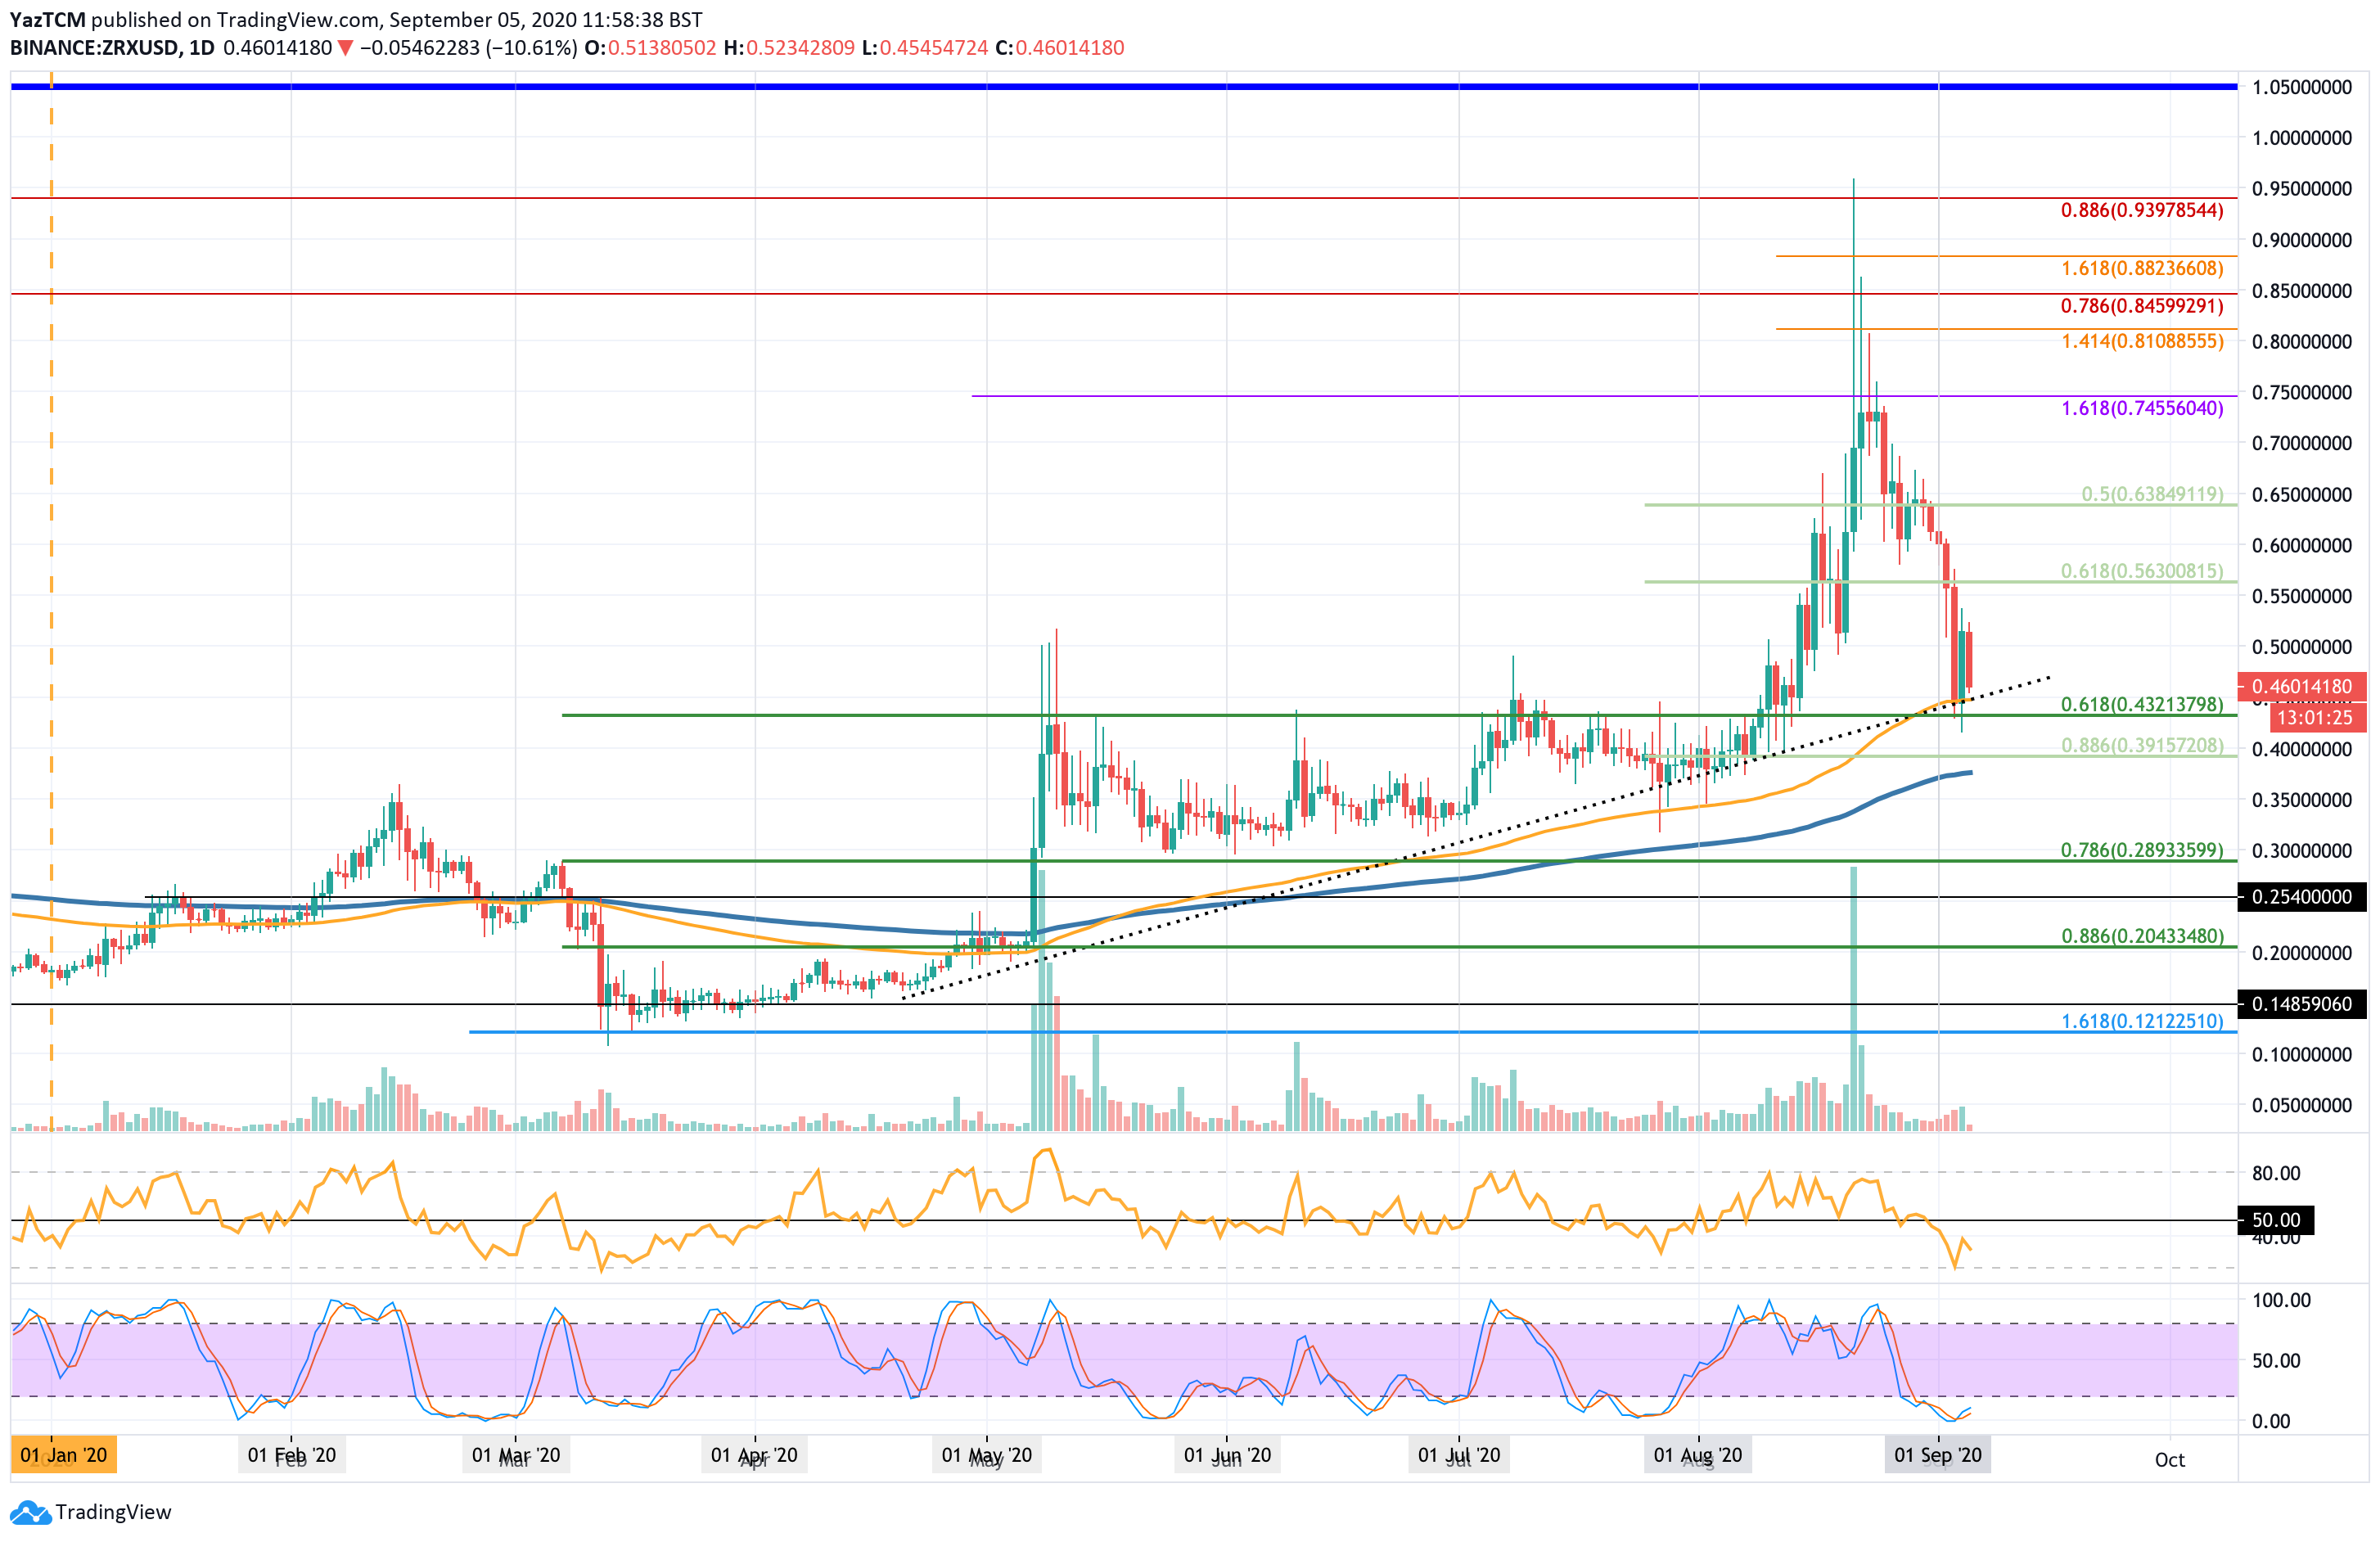
ZRX fell by 30% this week as the coin hit the $0.46 level. Like most coins on this list, ZRX had surged higher in August to reach a high-day close of around $0.75. From there, the cryptocurrency started to roll over and head lower.
At the start of September, ZRX was trading at around $0.6. Fro, there, it headed lower until it reached support at a dotted rising trend line. This support was further b bolstered by the 100-day EMA that lies exactly in the same location.
Looking ahead, if the sellers push lower, we can expect the first level of support at the rising trend line again. Beneath this, support is first located at $0.432 (.618 Fib Retracement), and $0.4.
If the sellers continue to drive 0x beneath $0.4, support lies at $0.38 (200-day EMA), $0.35, and $.30.
On the other side, if the bulls manage to regroup and push higher, the first level of resistance lies at $0.5. This is followed by resistance at $0.55, $0.56, and $0.6.
5. Basic Attention Token
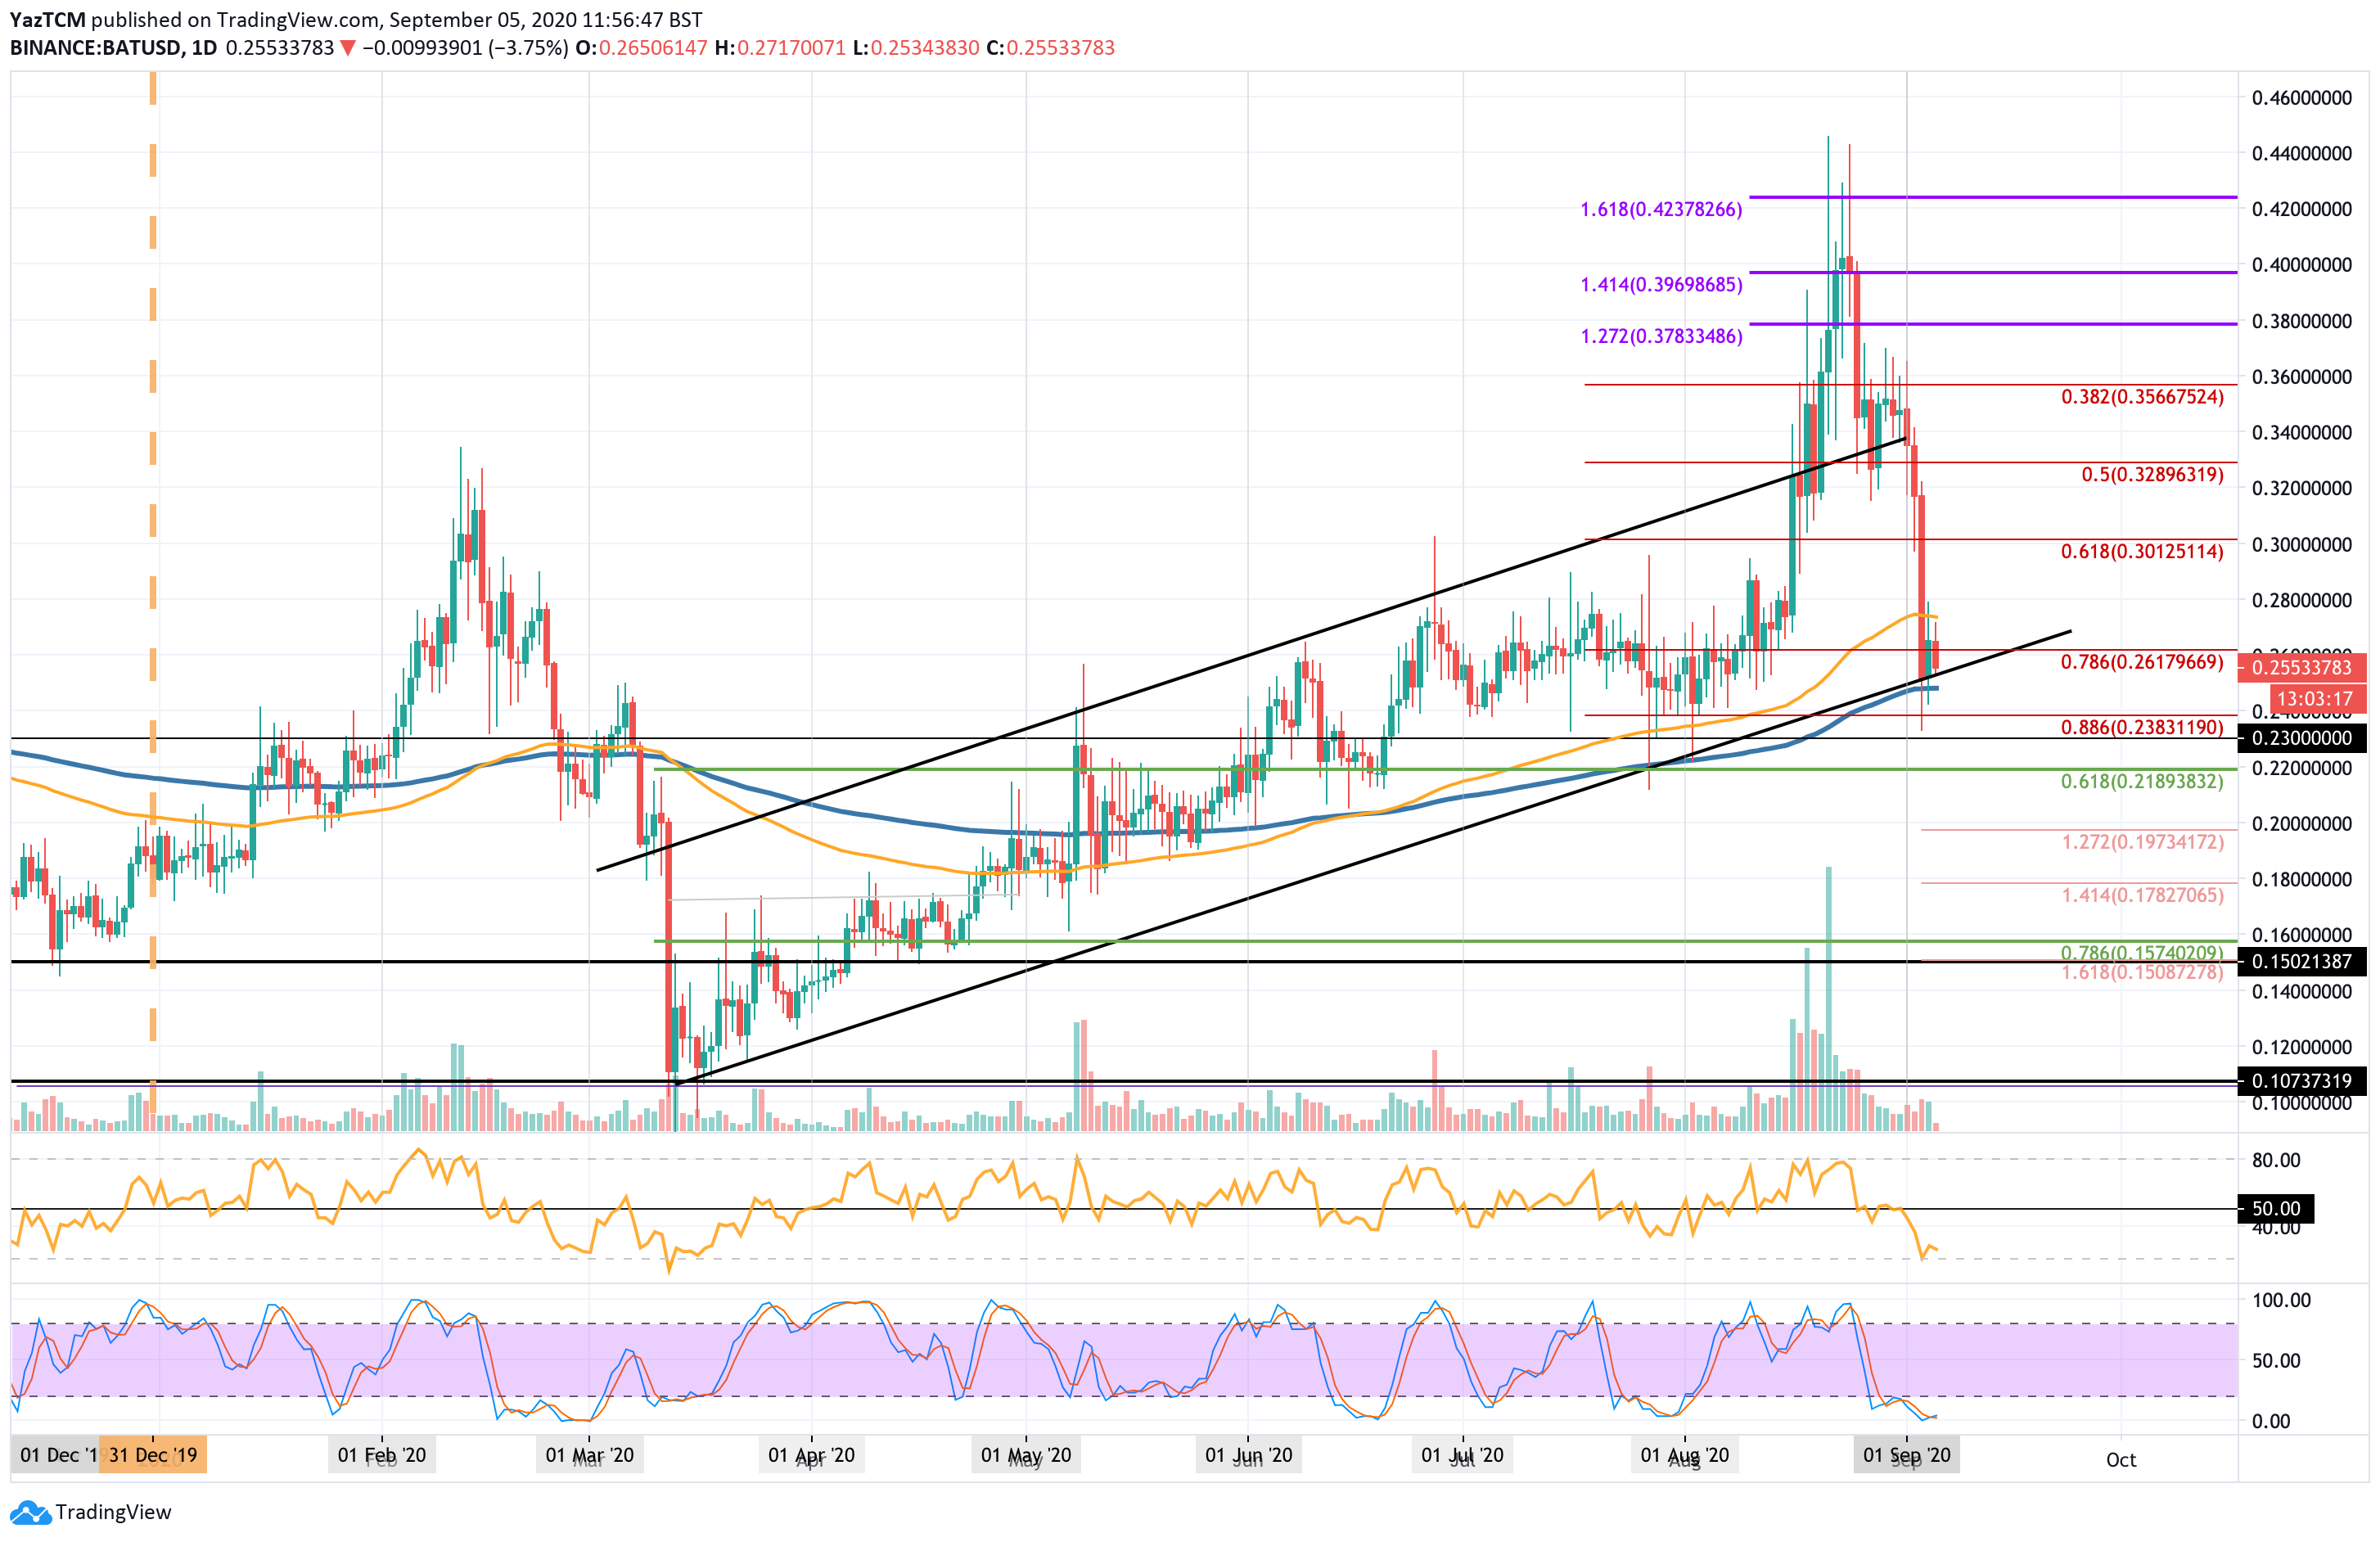
BAT dropped by 29.5% this week as the coin reached the $0.255 level. In August, BAT had surged higher to break above a rising price channel. It went on to close as high as $0.4 before the sellers stepped back in and pushed the market lower.
In September, we can see that BAT plummeted lower as it fell from $0.36 to reach the current $0.255 level. We can see that it managed to find support at the lower boundary of the previous rising trend line formation. This support was further bolstered by the 200-day EMA which lies in the same location.
Looking ahead, if the sellers break beneath the lower boundary of this price channel, support is first expected at $0.238 (.886 Fib Retracement). This is followed by support at $0.23, $0.218 (.618 Fib Retracement), $0.2 (downside 1.272 Fib Extension), $0.178 (downside 1.414 Fib Extension), and $0.16 (.786 Fib Retracement).
On the other side, resistance is located at $0.26. This is followed by resistance at $0.28, $0.301, $0.32, and $0.34.
Previous Top/Worst performers articles
At CoinCodex, we regularly publish price analysis articles focused on the top cryptocurrencies. Here are our most recent articles about the top/worst performers:
4y ago
bullish:
4
bearish:
4
Share


 Manage all your crypto, NFT and DeFi from one place
Securely connect the portfolio you’re using to start.

bullish:
0
bearish:
0


bullish:
2
bearish:
0

bullish:
0
bearish:
0