Monero, Algorand, DigiByte Price Analysis: 28 September
4y ago
bullish:
0
bearish:
0
Share

Monero was moving within an ascending channel at press time, but it might face stiff resistance at and just beyond the $100-mark. Algorand has shown bullishness over the past few days and looked poised to see another hike in the next few trading sessions.
DigiByte's charts pointed to a lack of momentum in the near-term, which may be why DGB was likely to be heading south in the next few days.
Monero [XMR]
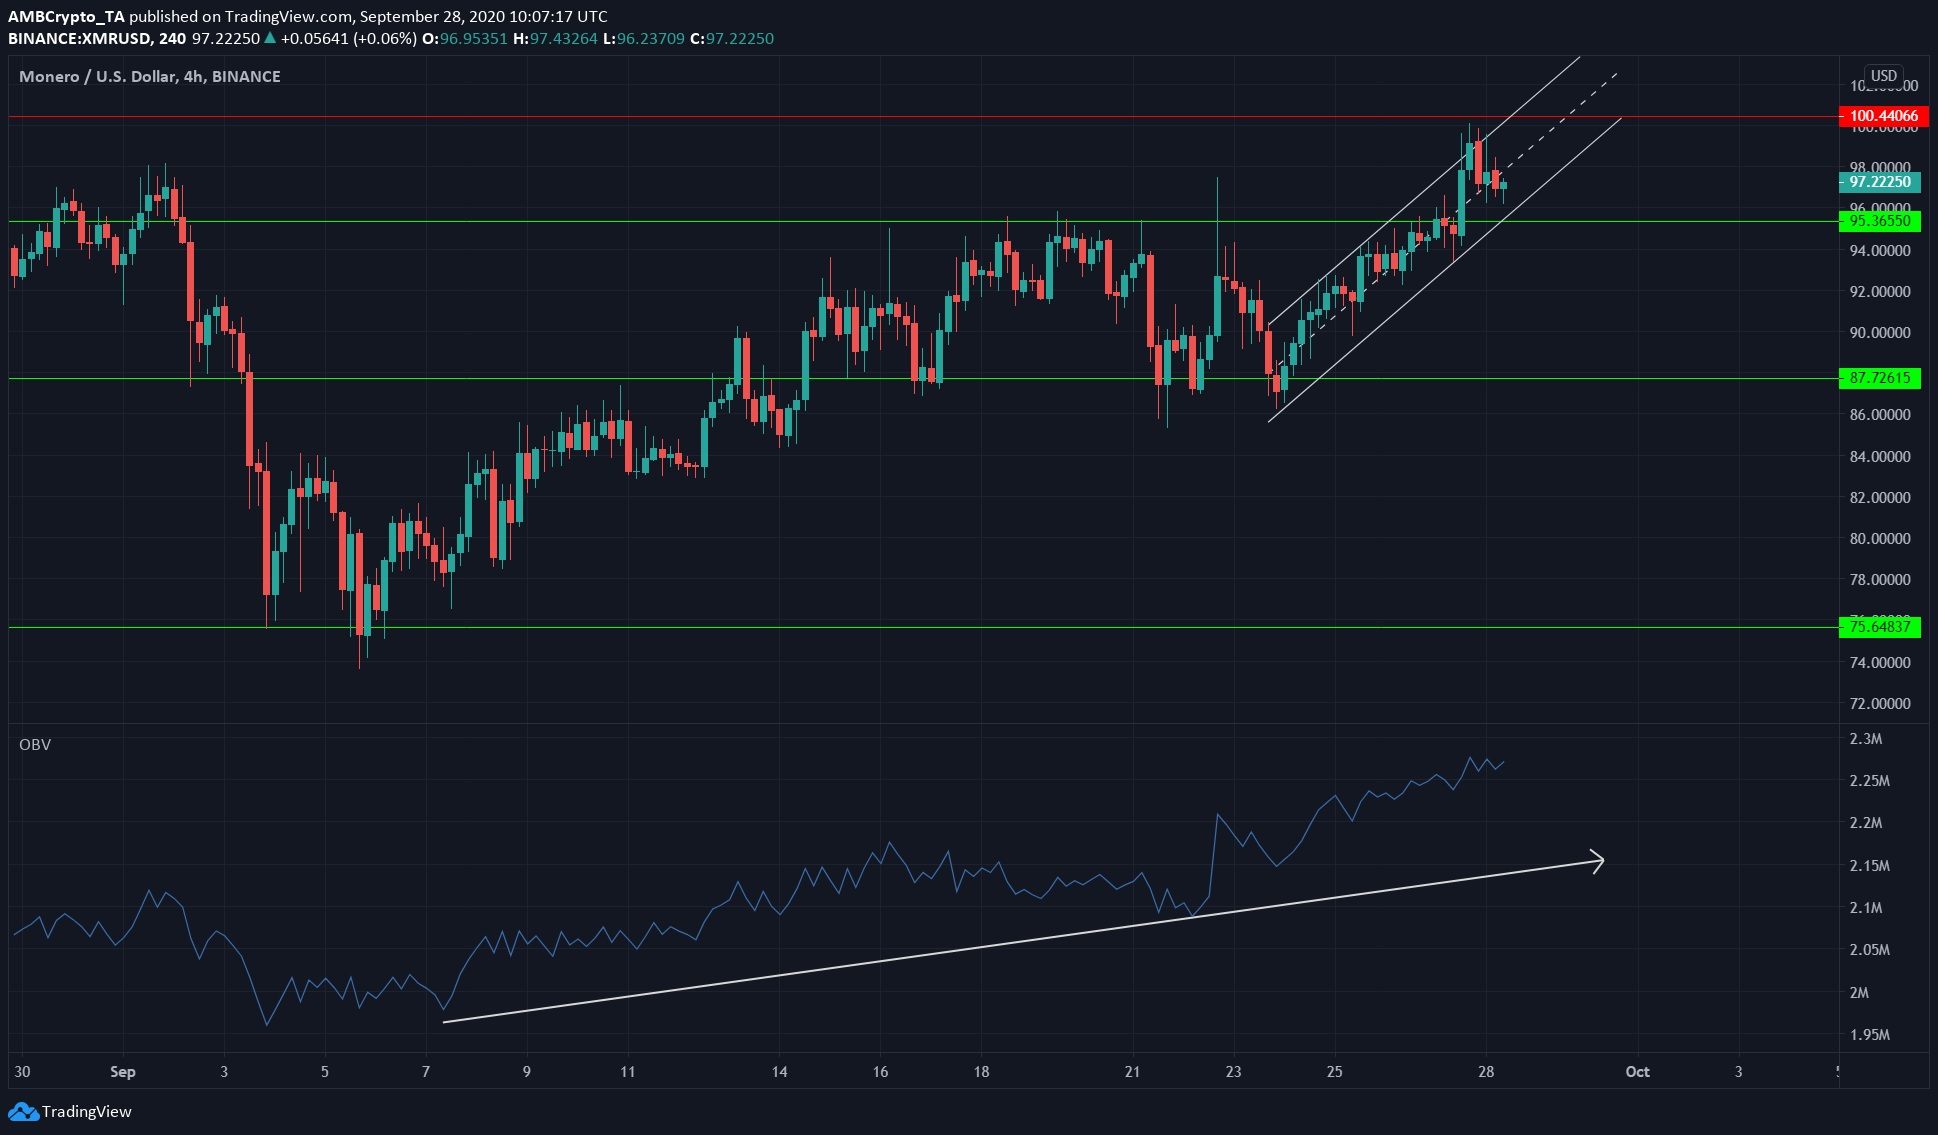
Source: XMR/USD on TradingView
The On Balance Volume showed that Monero was being steadily bought since the early-September plunge.
There was a period of selling pressure, but overall, both OBV and the price were noted to be trending upwards.
Further, XMR recently showed a bullish divergence. It can be expected to continue moving within the ascending channel toward the $100 and $105-levels of resistance. The region at $100 has been strong resistance for a year. A breakout beyond $100 would be very bullish, both in the near and long-term.
A rejection at $100 is also possible and could take the price back to the $90-$87 zone.
Algorand [ALGO]
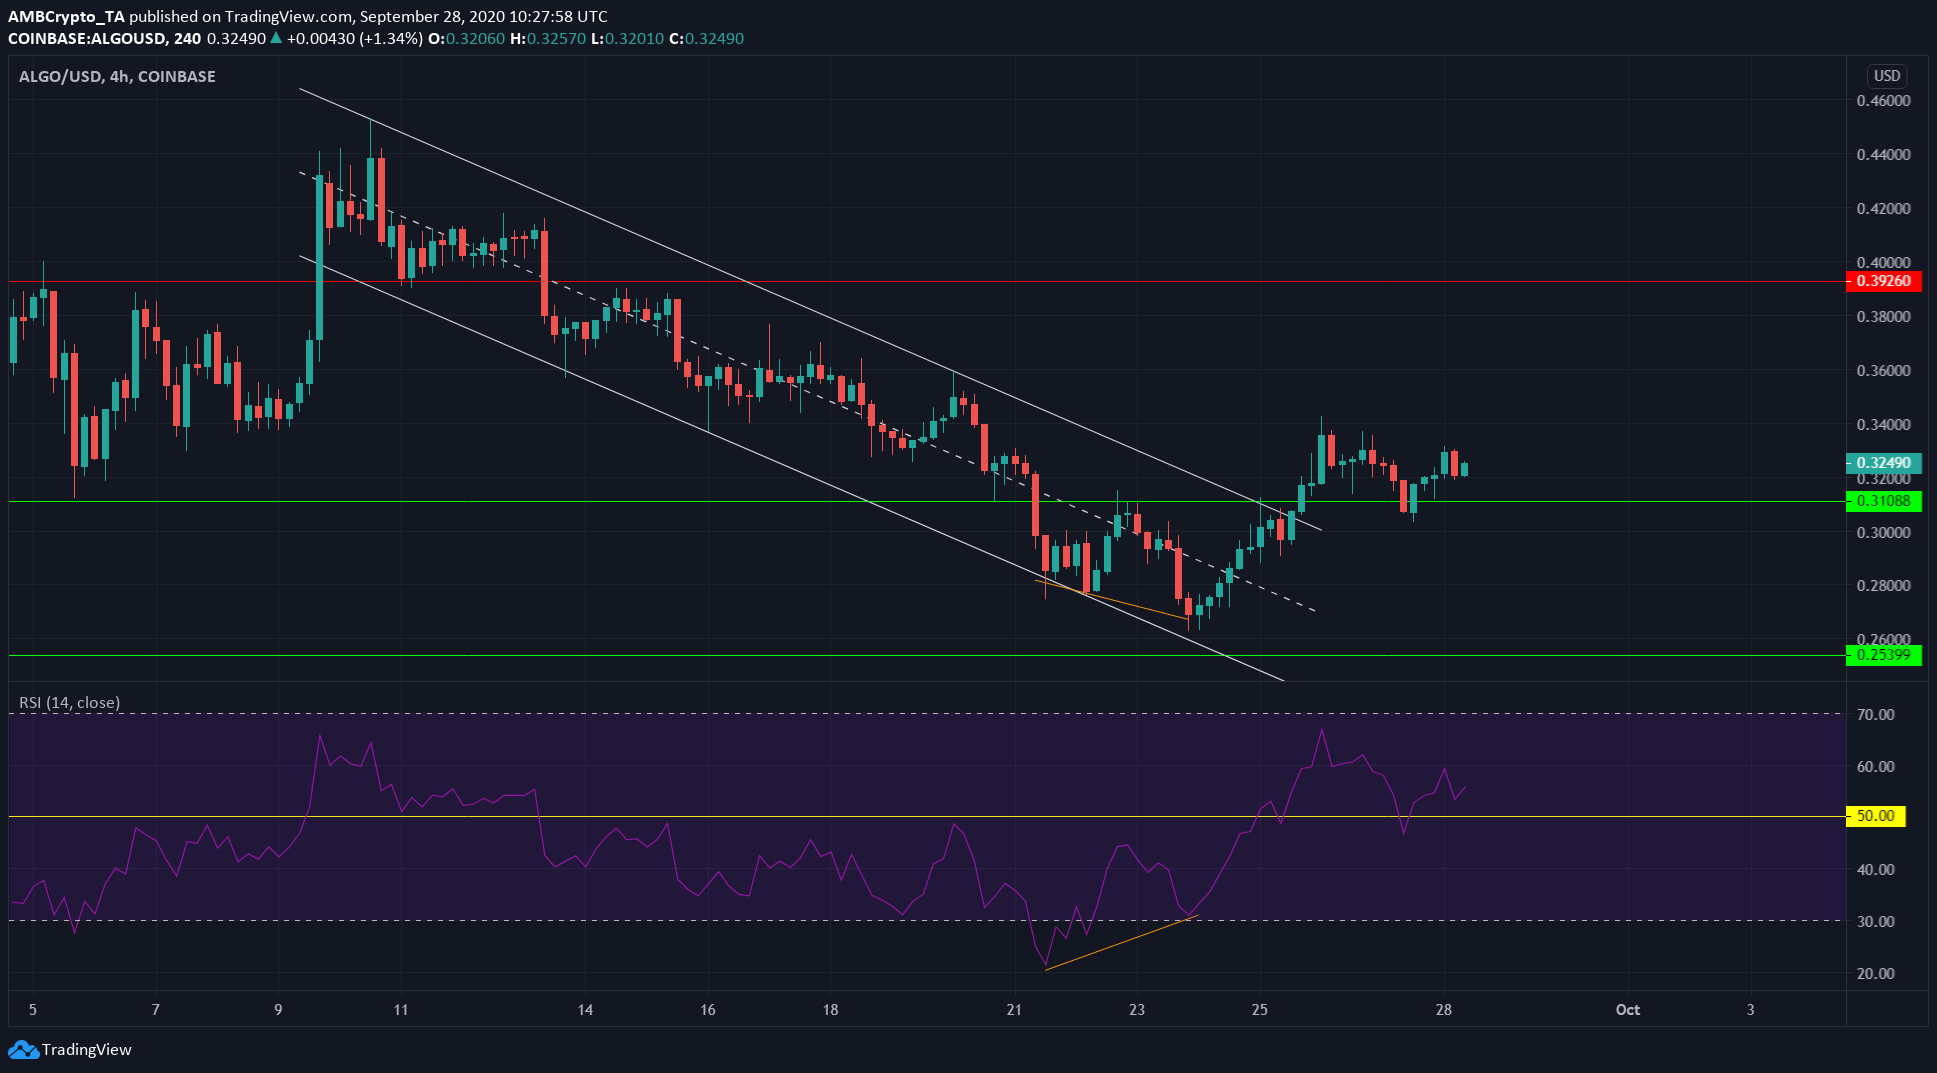
source: ALGO/USD on TradingView
Algorand broke out of the descending channel it was trading within and flipped the level of resistance at $0.31 to support.
The RSI also showed bullishness for the crypto-asset. It had a value of 54, at press time. More importantly, the RSI failed to dip significantly below 50 after the successful defense of the support at $0.31.
If ALGO closes above the most recent high at $0.33, it will likely move towards the resistance level $0.39. Failure to close a trading session above $0.33 could deflate the bullish momentum around ALGO.
DigiByte [DGB]
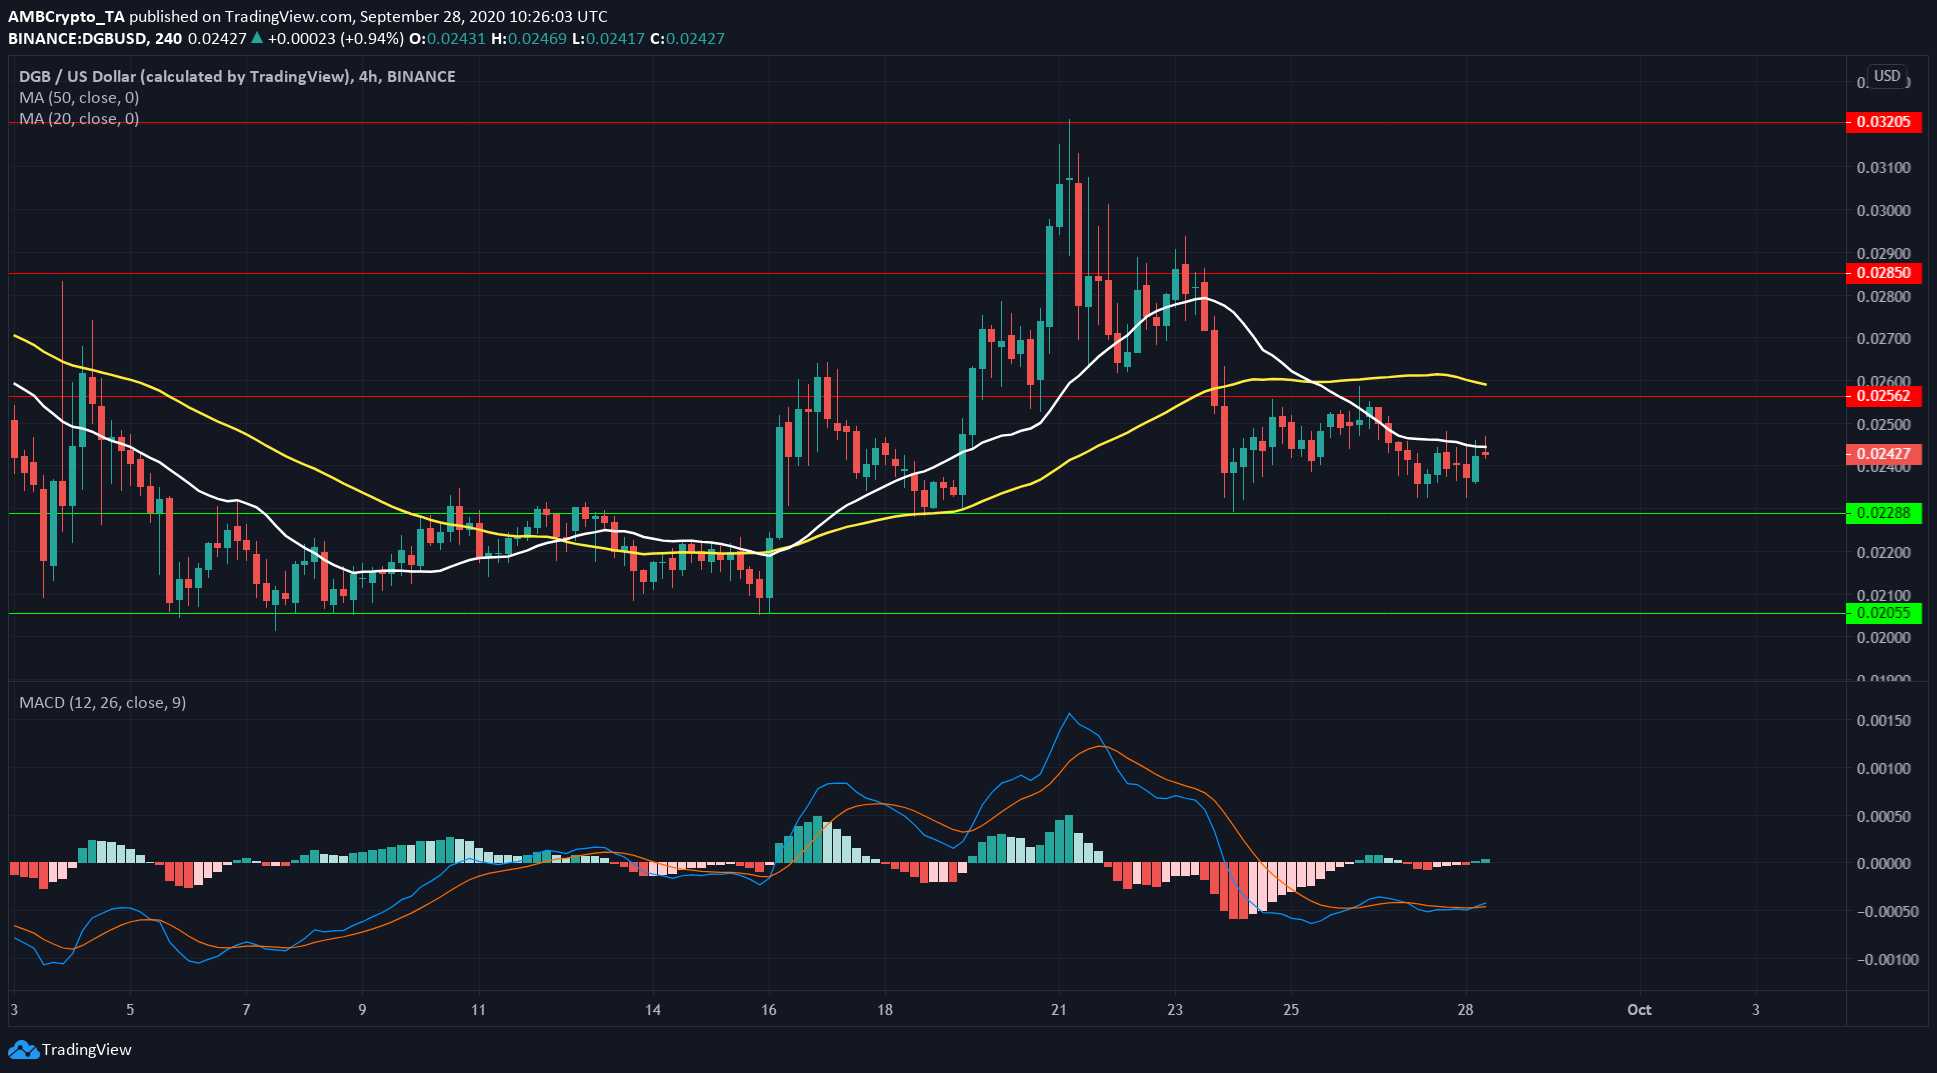
Source: DGB/USD on TradingView
The MACD was moving beneath the zero line, but both the Signal line (orange) and the MACD line (blue) were close together, at press time, and generated no discernable signal.
However, their proximity indicated the lack of momentum in one direction for DGB as it oscillated around $0.0245. Their position beneath the zero line also signified recent bearishness. The 50 SMA (yellow) was above the 20 SMA (white), also suggesting short-term bearishness.
The immediate levels of support and resistance lay at $0.0228 and $0.0256, respectively. The moving averages can also be expected to act as resistance.
The post Monero, Algorand, DigiByte Price Analysis: 28 September appeared first on AMBCrypto.
4y ago
bullish:
0
bearish:
0
Share


 Manage all your crypto, NFT and DeFi from one place
Securely connect the portfolio you’re using to start.

bullish:
0
bearish:
0


bullish:
1
bearish:
0

bullish:
0
bearish:
0