Tezos, Synthetix, FTX Token Price Analysis: 21 November
3y ago
bullish:
2
bearish:
0
Share

Bitcoin's Dominance had fallen to 66.36% at press time, having reached a high of 67.6% a few days ago. Thanks to BTC's recent performances, it could be a Bitcoin-dictated show for many more days, before attention and capital can be diverted to the altcoin market. Further down the crypto-ladder, Tezos registered a bearish divergence and it could record some losses over the next few trading sessions. On the contrary, Synthetix remained bullish while FTX Token climbed past a level of resistance and could flip it to support.
Tezos [XTZ]
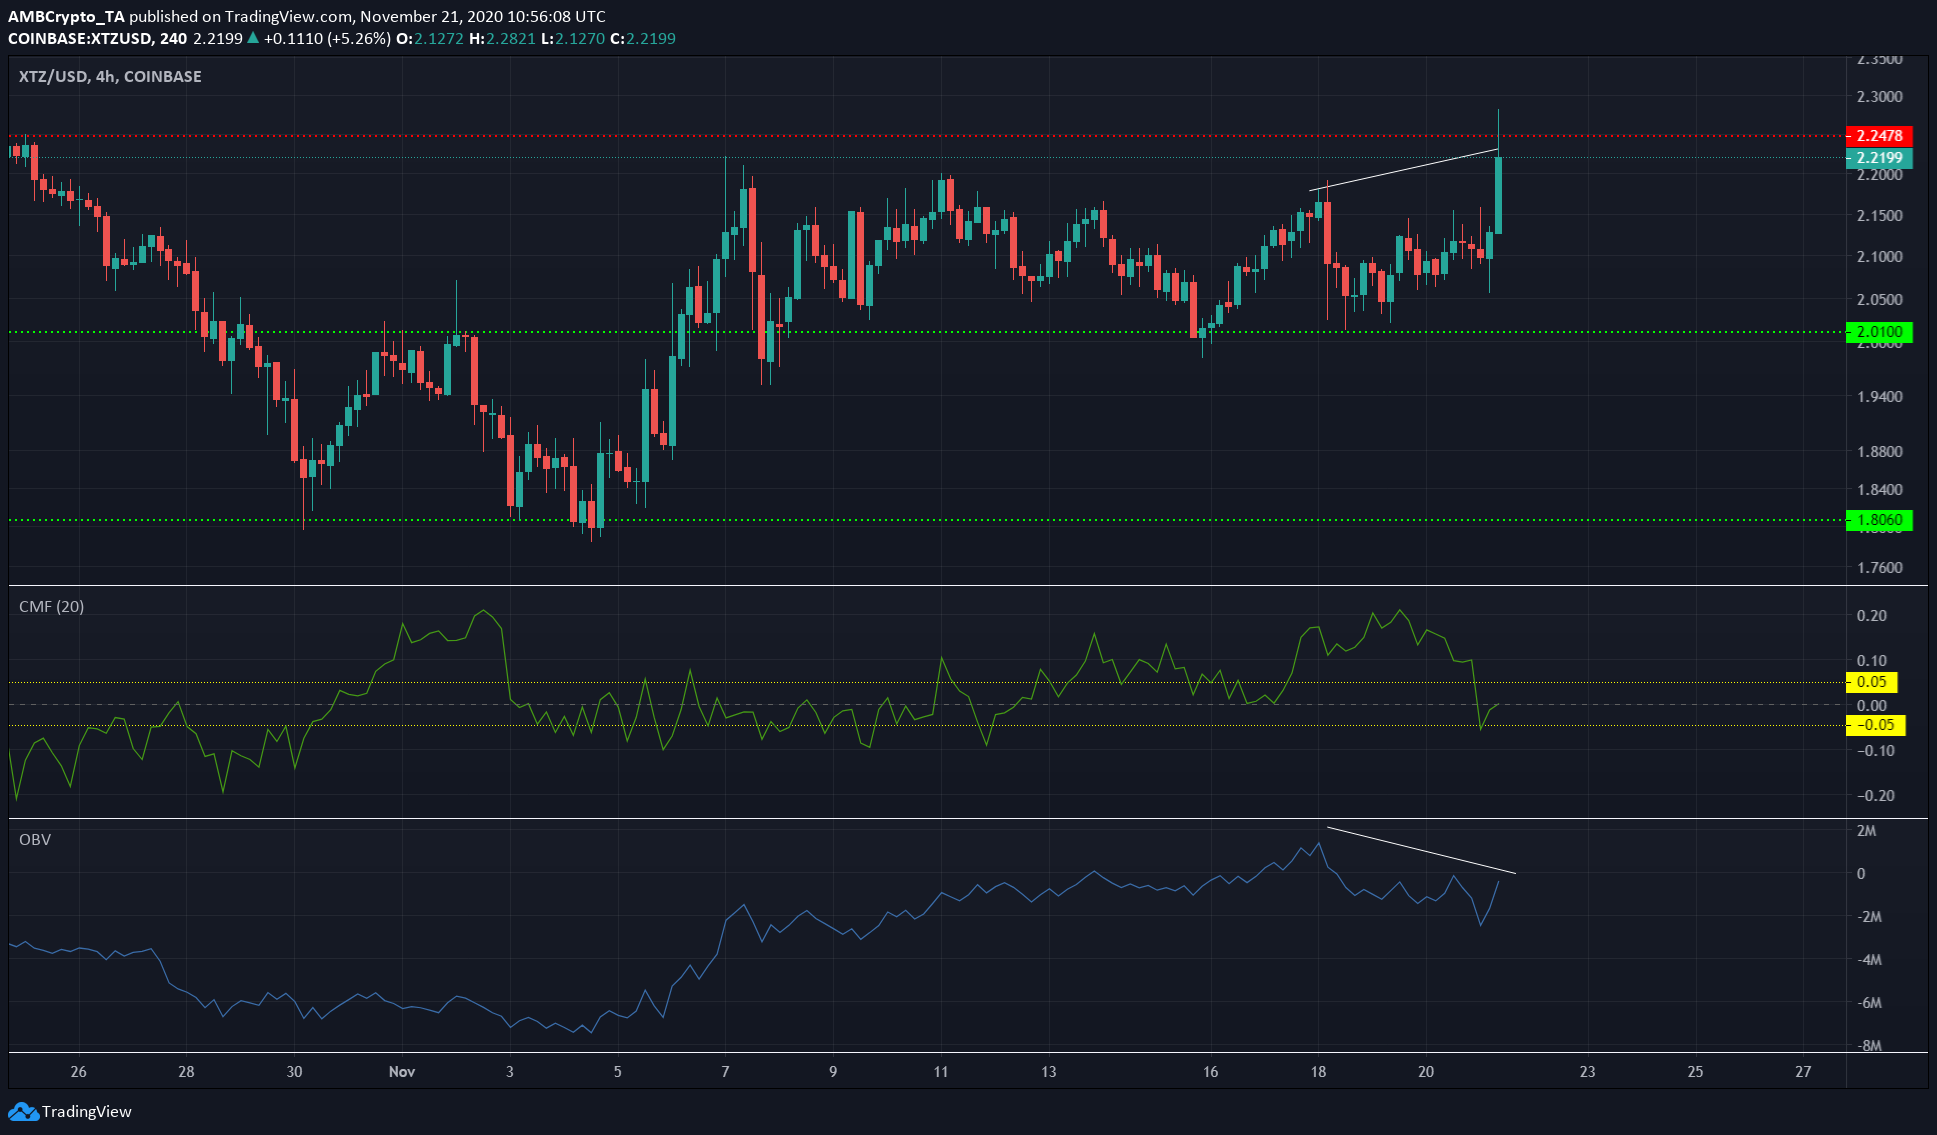
Source: XTZ/USD on TradingView
XTZ registered a bearish divergence between the price and the OBV. Despite a higher high in value, the OBV showed that XTZ did not have much buying volume to support its most recent gains.
This suggested that selling would follow and drive the price back down towards the support at $2. The Chaikin Money Flow had also dropped to indicate that capital flows into the market had decreased, and buyers and sellers were much more evenly matched.
In related news, the French bank CA CIB and a French public sector financial sector Caisse des Dépôts announced the launch of a project exploring digital interbank currency (DIBC). Ethereum and Tezos blockchain technologies were chosen to explore how financial transactions of digital assets can be settled on platforms.
Synthetix [SNX]
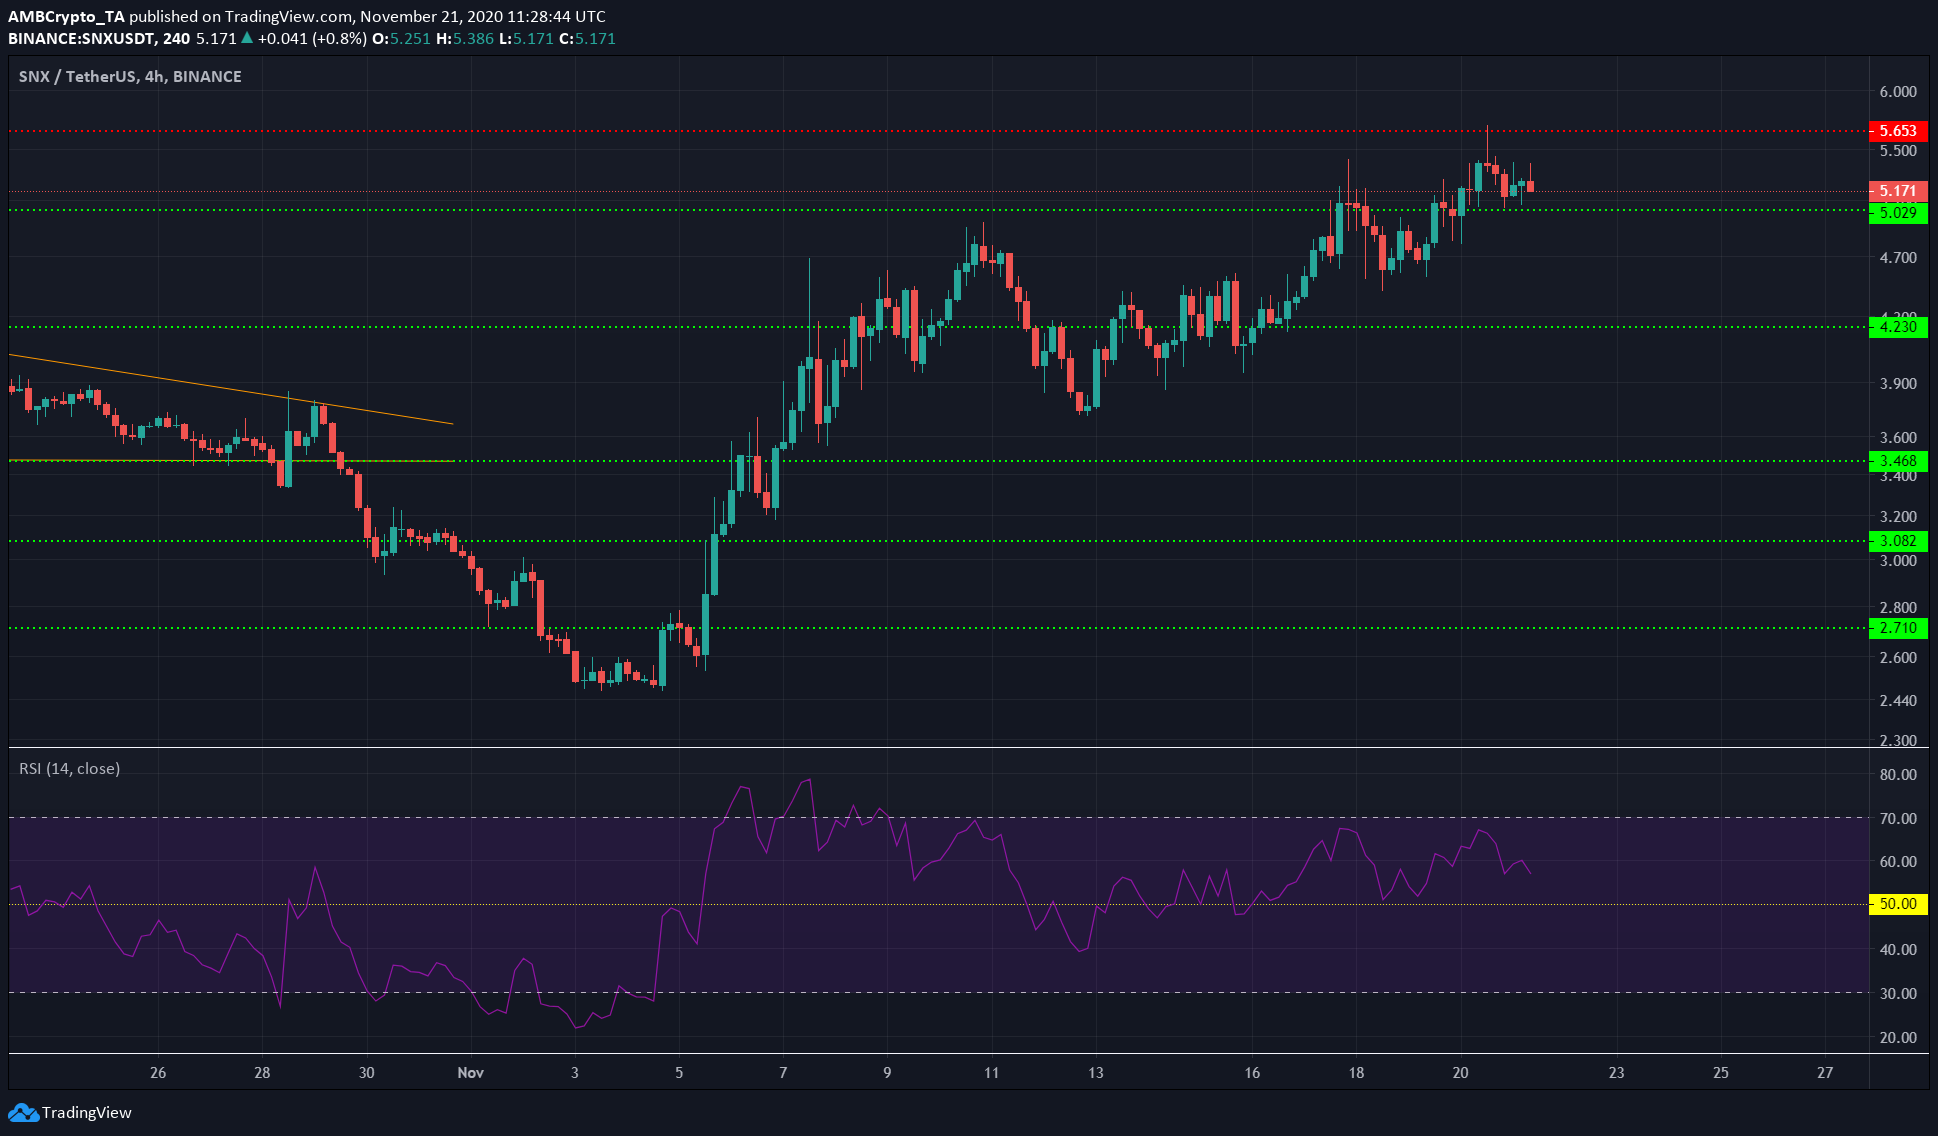
Source: SNX/USDT on TradingView
SNX was trading at $5.197, at the time of writing, and it could see a minor dip to $5, before another move upwards.
The RSI has been in bullish territory over the past week and indicated that an uptrend was in play. SNX had also recently flipped the resistance at $5 to support.
Hence, unless the price was forced to close below $5, and headed under $4.8 as well, a move towards the resistance at $5.65 can be expected.
FTX Token [FTT]
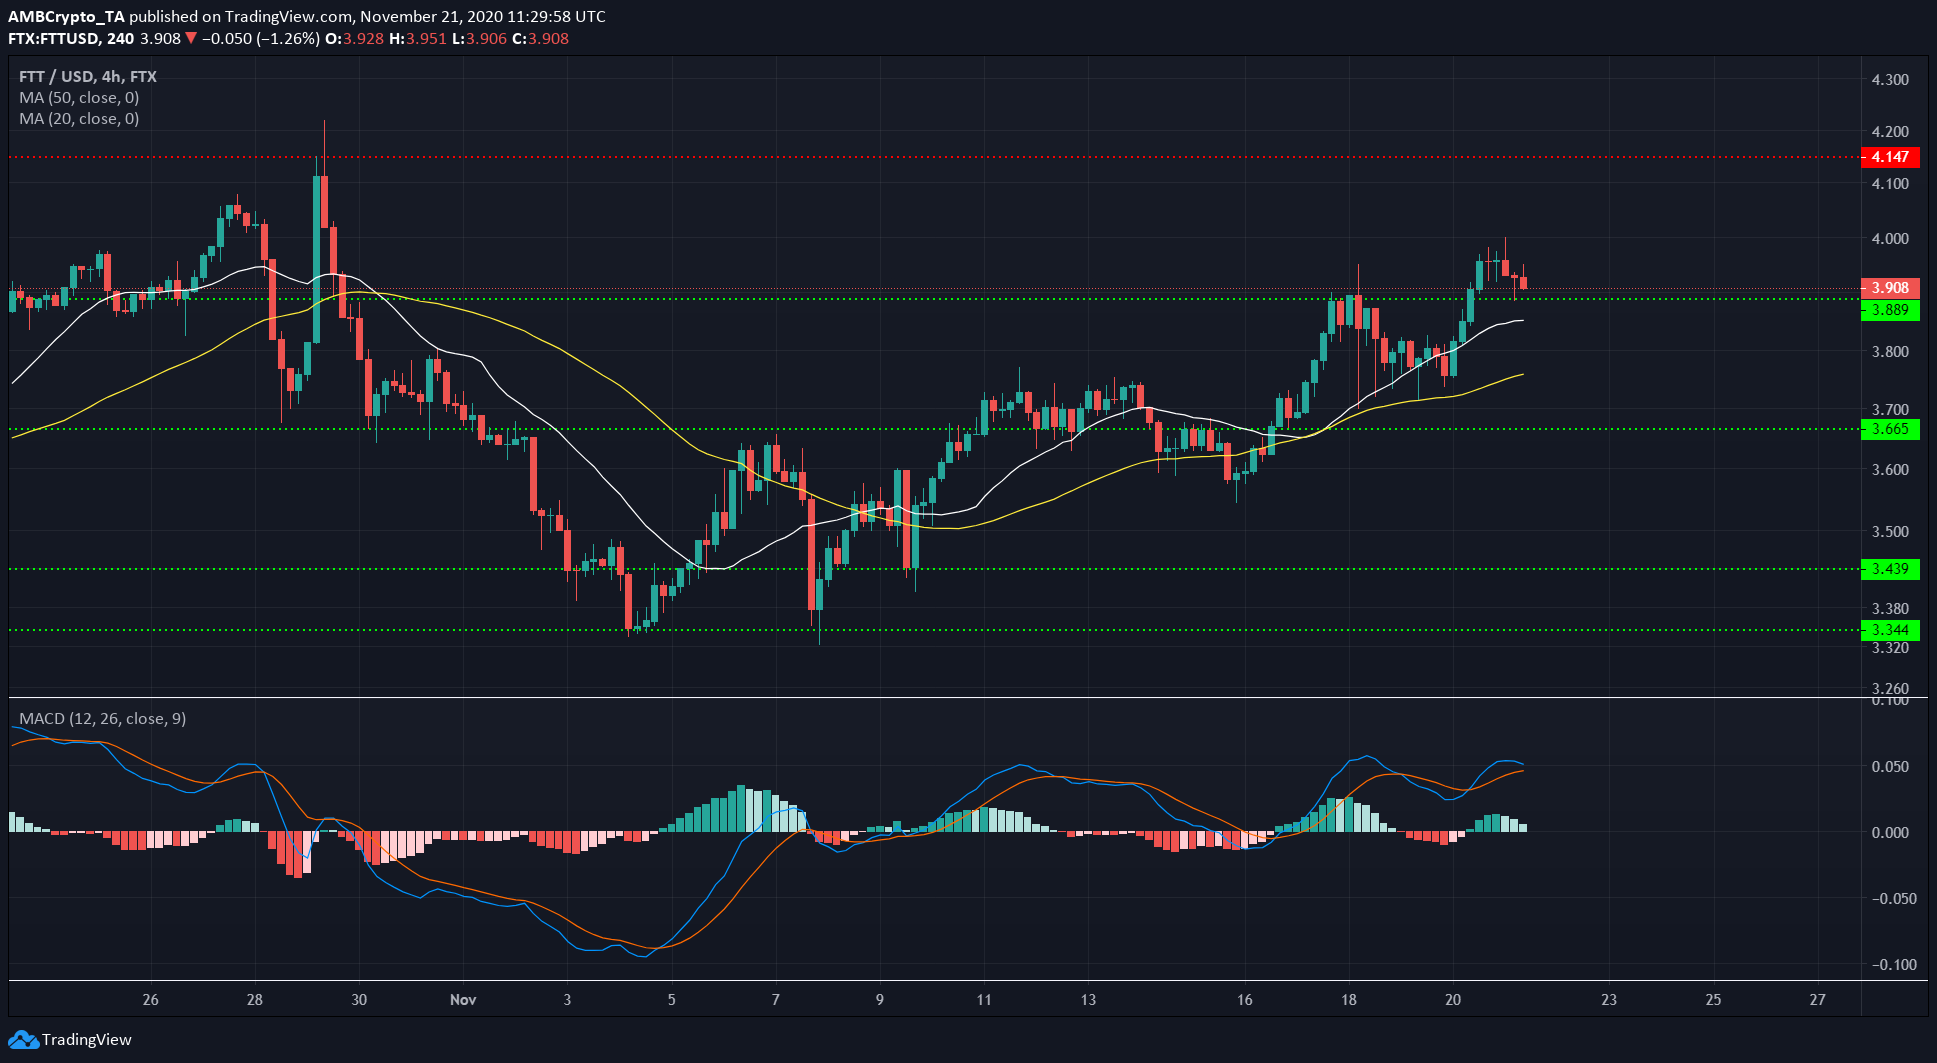
Source: FTT/USD on TradingView
The 20 SMA (white) was moving above the 50 SMA (yellow) and the price was above both the short-term moving averages to highlight strong bullishness behind the exchange token's recent price movement.
The MACD was above zero but could form a bearish crossover if the price continued to dip. FTT can expect to find support from its moving averages.
A close below the 50 SMA would signal that bearish momentum was likely exhausted. A defence of the $3.9-level of support could give bulls the impetus to push the price towards the resistance at $4.15.
The post Tezos, Synthetix, FTX Token Price Analysis: 21 November appeared first on AMBCrypto.
3y ago
bullish:
2
bearish:
0
Share


 Manage all your crypto, NFT and DeFi from one place
Securely connect the portfolio you’re using to start.

bullish:
0
bearish:
0

bullish:
0
bearish:
0

bullish:
0
bearish:
0

bullish:
0
bearish:
0