Bitcoin Price Prediction: BTC Symmetrical Triangle Breakout Aiming For $11,200
4y ago
bullish:
0
bearish:
0
Share

- Bitcoin bulls remain relentless in the fight for gains above $11,000 following triangle breakout.
- More upward price action awaits Bitcoin, especially if the resistance between $10,678 and $10,978 is flipped into support.
Bitcoin sliced through the resistance at $10,600 on Monday during the American session. The breakout took place following a breather from the gains witnessed over the weekend but lost steam short of $10,600. BTC/USD breaking above $12,400 hinted that there is potential for more gains with $11,000 becoming a near term target.
Meanwhile, the flagship cryptocurrency is trading at $10,680 after an impressive symmetrical triangle breakout. With the resistance at $11,600 in the rearview, the biggest question is whether BTC will have the volume to sustain gains above $11,000, considering an upside target of $11,200.
BTC/USD daily chart

From a technical perspective, the largest cryptocurrency is mainly in the hands of the bulls. However, it is essential to take note of the Relative Strength Index (RSI) which has started to level at 46.42 in the wave of a remarkable recovery from levels closer to the oversold. If the sideways motion holds, investors should expect delays in the run-up beyond $11,000. Besides, Bitcoins journey to $11,200 anticipates resistance at $10,800 and $11,000 respectively.
Following a couple of weeks of consolidation, the Bollinger Bands indicate the return of volatility into the market. The breakout has already been confirmed to the upsides. In this case, the ball is in the bulls’ court. The RSI in the 1-hour chart shows the RSI still trending upwards, present more buy signals for the crypto in anticipation of gains above $11,000.
BTC/USD 1-hour chart

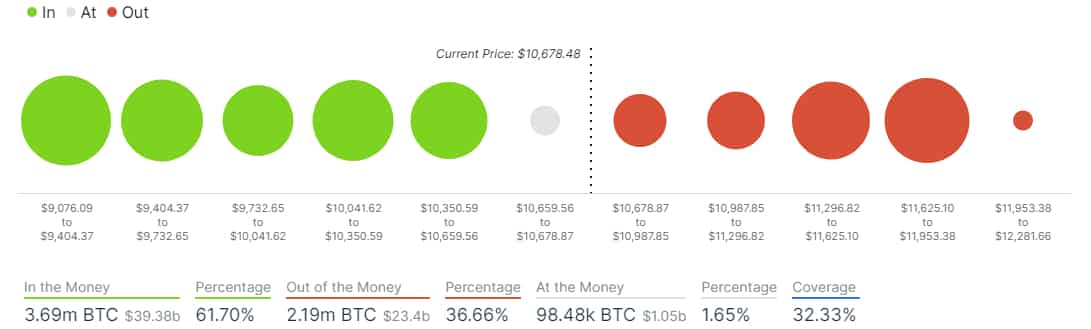
On-chain data by IntoTheBlock, a growing Bitcoin fundamental analysis platform suggests that once the resistance zone in the range between $10,678 and $10,978 where 398,390 addresses purchased 267,940 BTC is flipped into support, the flagship cryptocurrency will sail through $11,000 quickly. The next significant hurdle stands between $11,296 and $11,625 where 1.26 million addressed previously bought 671,840 BTC.
IntoTheBlock IOMAP chart
Bitcoin Intraday Levels
Spot rate: $10,690
Relative change: 15
Percentage change: 0.19%
Trend: Bullish
Volatility: Bearish
The post Bitcoin Price Prediction: BTC Symmetrical Triangle Breakout Aiming For $11,200 appeared first on Coingape.
4y ago
bullish:
0
bearish:
0
Share


 Manage all your crypto, NFT and DeFi from one place
Securely connect the portfolio you’re using to start.

bullish:
0
bearish:
0

bullish:
0
bearish:
0

bullish:
0
bearish:
0
