Bitcoin price crosses $10000: Is Golden cross helping?
4y ago
bullish:
25
bearish:
2
Share

The king of cryptocurrency Bitcoin BTC is back in action, and the Bitcoin price has hit past the $10000 mark once again. The rise in the market trend came right after the Golden Cross prediction today, which was repeated by more than one analyst.
But the questions remain, would Bitcoin price sustain the current levels? Would it achieve a new high? Or would it simply fall back down in another bullish run? Let’s take a look at the major analyses, but before that, a quick recap of the past 24-hours is in order.
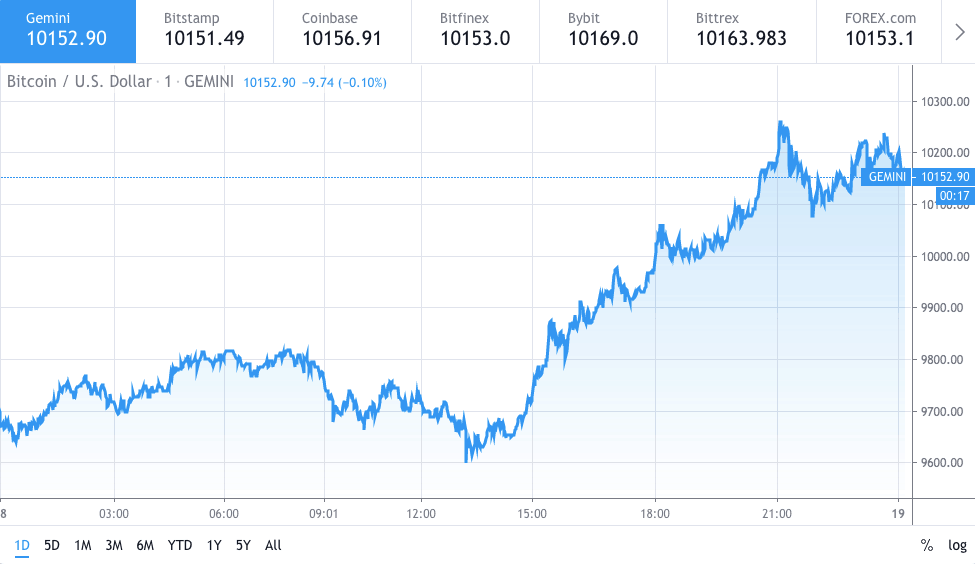 Bitcoin price chart by Trading View
BTC price hovered below the $9800 mark for the better part of the last 24-hours, and at one point, it seemed that all hope is lost when the charts displayed a decline to the $9600 mark. Following the low point, bulls took the rein and started moving the king steadily towards the $10000 mark, and before the end of the day (GMT time), Bitcoin price had hit the $10200 mark. At the time of writing, BTC price stands at the $10152.90 mark.
Bitcoin price movement: What to expect?
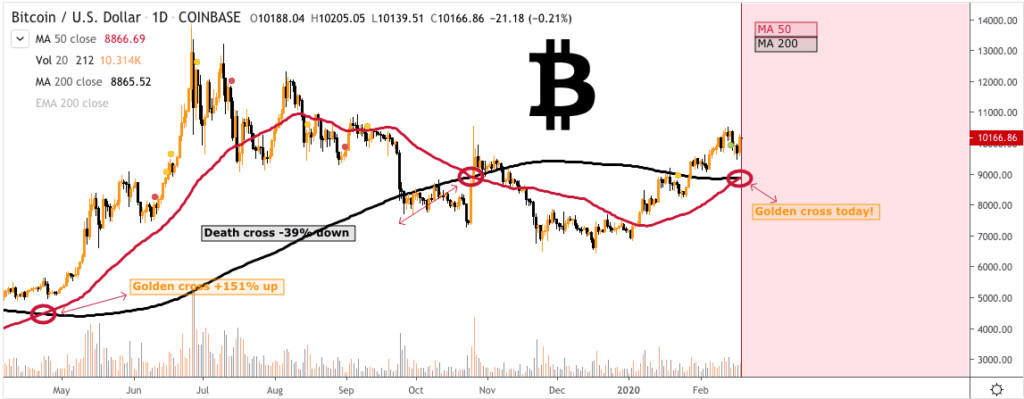
Bitcoin trader and analyst on Trading View, Bill Charison is of the view that the king of cryptocurrency is bound to take a leap after the long-range Golden Cross that appeared on the price charts today. Although he didn’t throw in a ballpark figure, one can conclude from his analysis that a better high around or above $10500 is in order.
 Bitcoin price chart by Trading View
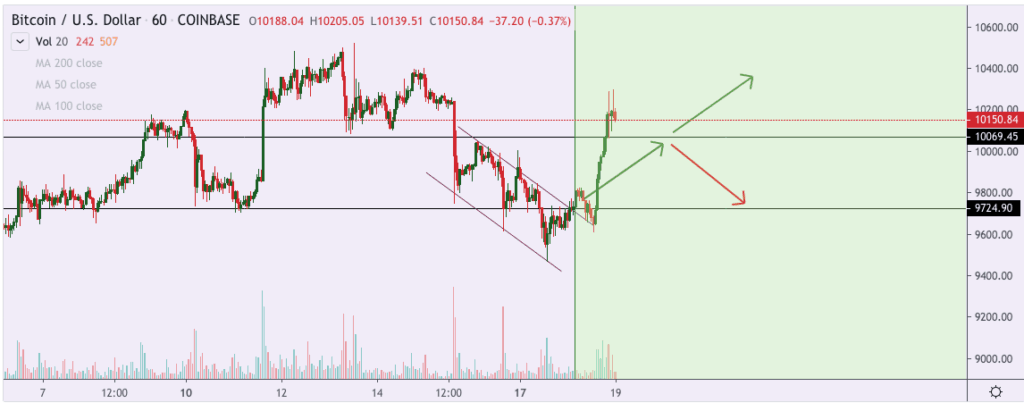
Similarly, another famous analyst on Trading View, William Lockhart, also presented an analysis that defines a little different tale of the situation. Lockhart’s analysis explains that shall the king continues to maintain the high point to the current levels, there is a good chance of a sway down to $9724 mark on the low end and $10400 mark on the high end. So far, his predictive analysis is not accurate to the mark.
 Bitcoin price chart by Trading View
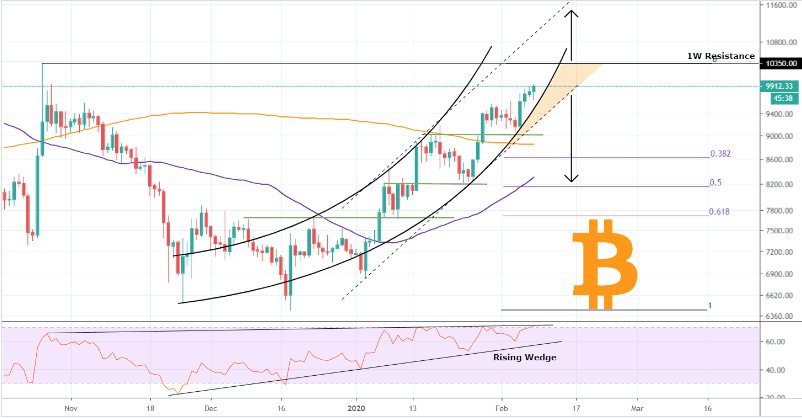
Last but not least, Trading Shot explains that the Bitcoin price movement is going through a crucial phase, and the current retracement levels are only natural. However, he furthers that the $10500 mark is merely the one-week resistance point. Shall the king coin manages to break through the strong resistance found at this level, a $12000 high would be imminent, Trading Shot explains.
 Bitcoin price chart by Trading View
The overall market sentiment is very strong at the time of writing despite a not so good crypto fear and greed index score. The index stands at a score of 53, unlike last week’s high score of 61, yet the king of cryptocurrency is emerging just as strong as major altcoins that displayed tremendous come back on Tuesday while the king rested its legs for a while.
Nevertheless, traders are advised caution before making any serious trading decision and do not at all, we repeat, not at all enter into a gamble play in the hopes of high yield.
Featured Image by AntonPetrus
Disclaimer: The information provided is not trading advice but an informative analysis of the price movement. Cryptopolitan.com holds no liability towards any investments based on the information provided on this page.
4y ago
bullish:
25
bearish:
2
Share

 Manage all your crypto, NFT and DeFi from one place
Securely connect the portfolio you’re using to start.

bullish:
0
bearish:
0

bullish:
2
bearish:
1

bullish:
0
bearish:
0

bullish:
1
bearish:
0