Bitcoin SV, Cosmos, VeChain Price Analysis: 19 November
3y ago
bullish:
5
bearish:
0
Share
The impact of the world's largest cryptocurrency's price movement was evident this week after many of the crypto-market's alts followed BTC's lead to record gains of their own on their charts. Interestingly, while Bitcoin was continuing to consolidate after failing to sustain a breach of the much-anticipated $18K-mark, most alts were already starting to see some corrections take shape, at press time.
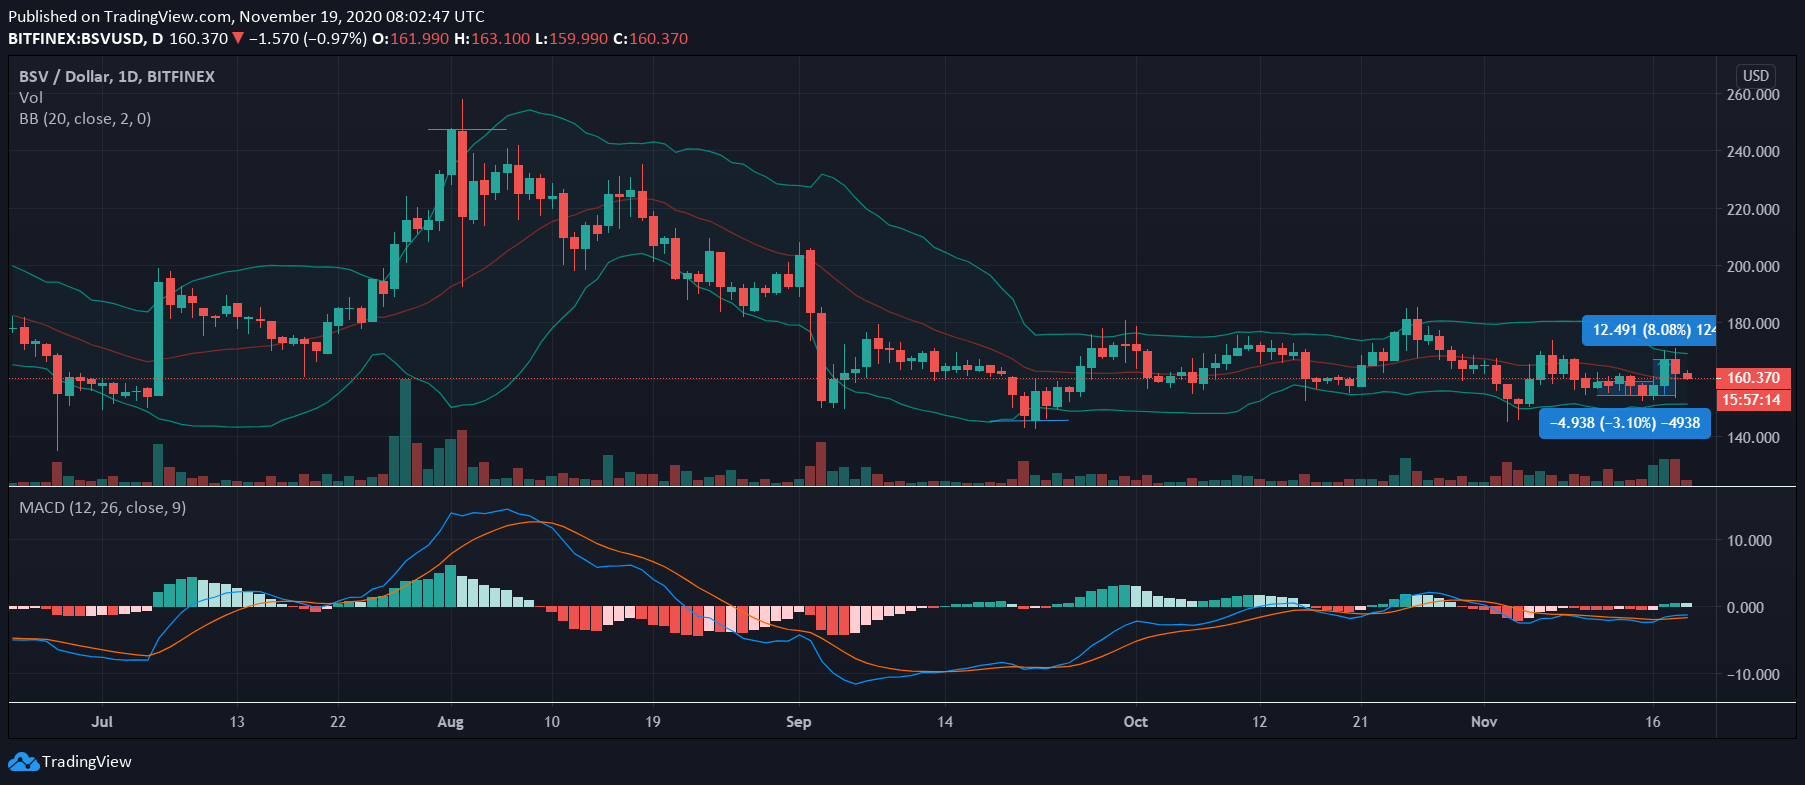
Bitcoin SV [BSV]
Source: BSV/USD on TradingView
Bitcoin SV, the infamous fork coin, hasn't had a good year. In fact, while like most alts BSV did surge on the charts in the month of August, unlike most alts, the next few months saw BSV struggle to get out of its bearish downtrend. Ergo, Bitcoin's hike couldn't have come at a better time as on the back of BTC's movement, BSV hiked by over 8% on the charts. It should be noted, however, that it is still unclear as to whether the latest hike might push BSV to register a trend reversal.
While the width of the Bollinger Bands remained uniform around the price candles, the MACD line was hovering just over the Signal line after a bullish crossover on the charts.
Bitcoin SV made news recently after Gregory Maxwell commented on a popular BSV multisig that he claimed provided no security whatsoever.
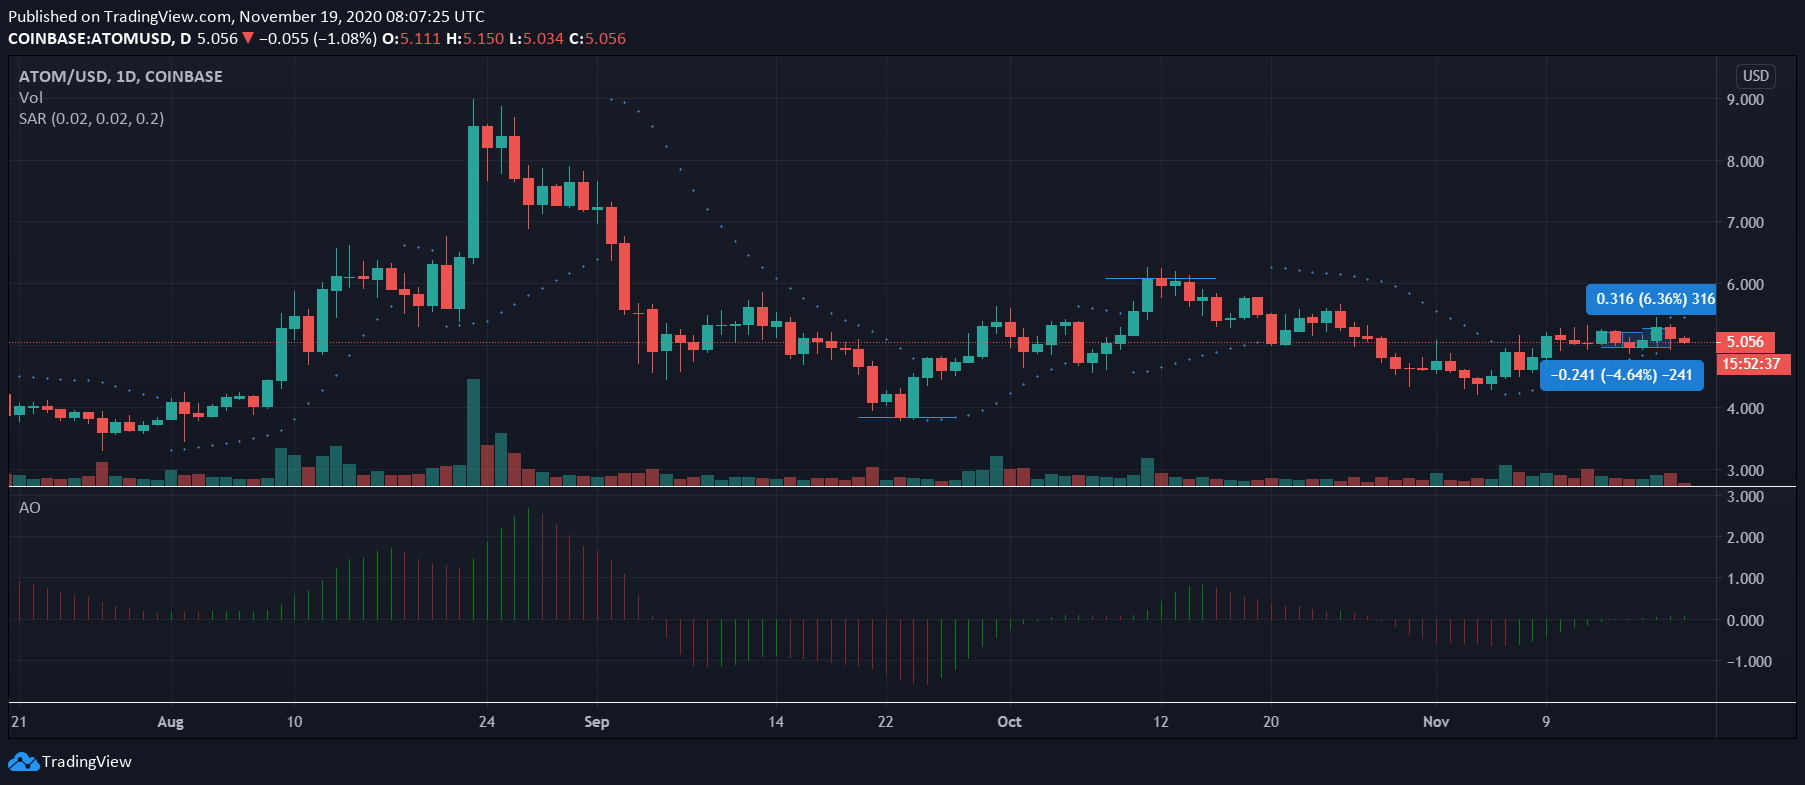
Cosmos [ATOM]
Source: ATOM/USD on TradingView
Like Bitcoin SV, Cosmos has had a very inconsistent 2020, with ATOM failing to sustain an uptrend after its dramatic fall on the charts in the month of August. While Bitcoin's uptick did push ATOM's price by 6%, it did not look enough to initiate any sort of trend reversal on the charts, especially since corrections were already on their way. In fact, at the time of writing, Cosmos was still trading closer to its support level than its resistance level.
The lack of a definite trend on the charts was highlighted by ATOM's indicators as while the Parabolic SAR's dotted markers seemed to switch furiously over the past week, the Awesome Oscillator underlined the lack of market momentum for Cosmos.
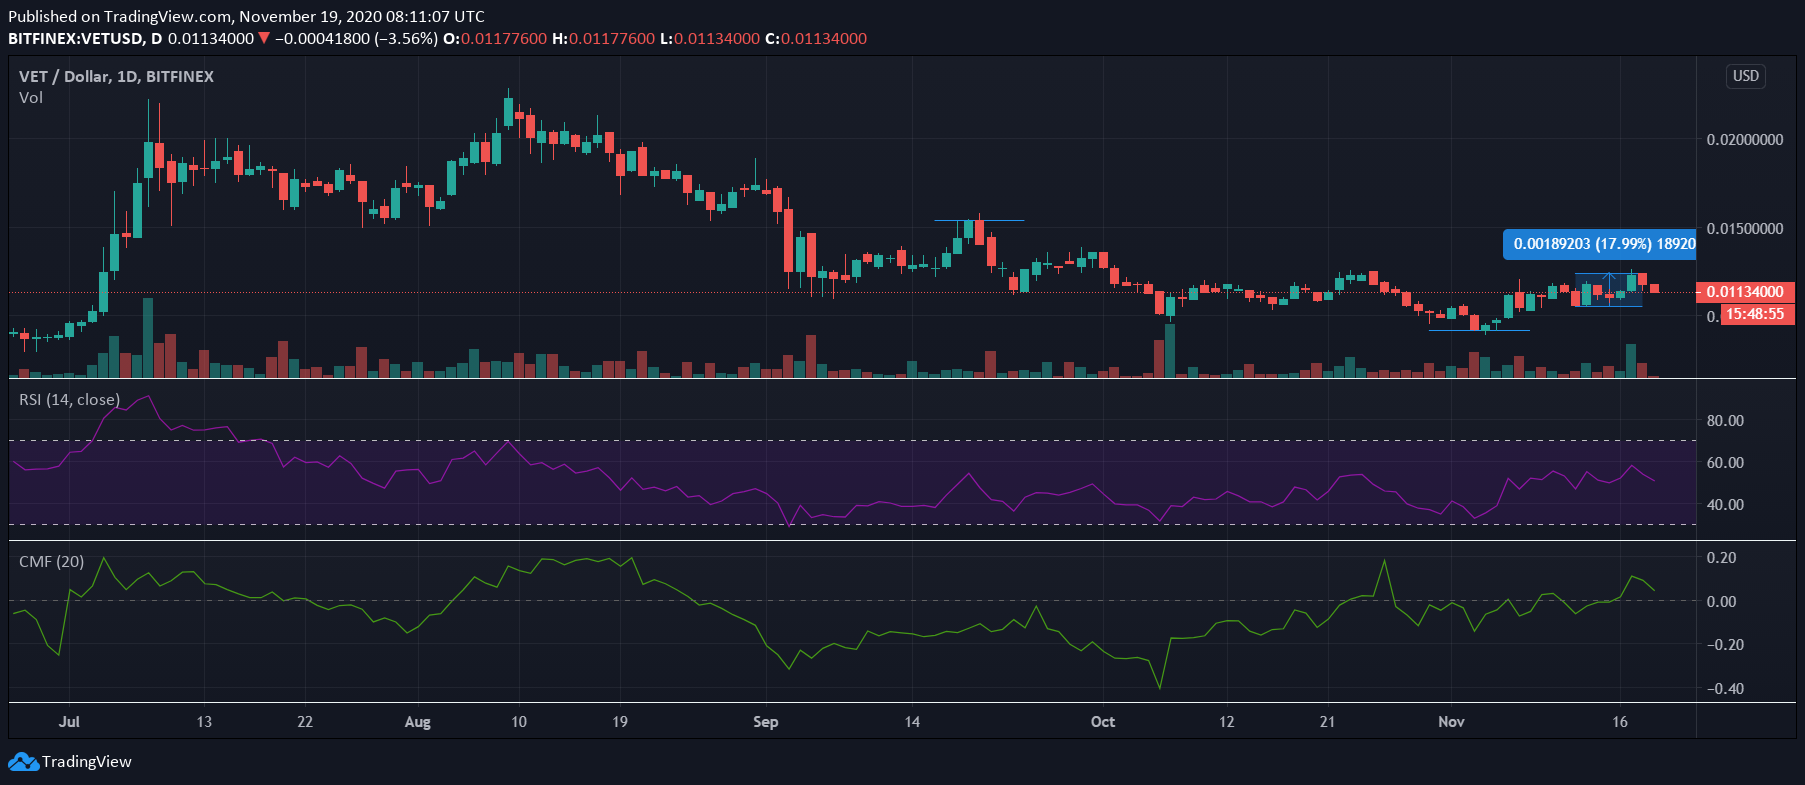
VeChain [VET]
Source: VET/USD on TradingView
The movements of VeChain, the cryptocurrency ranked 31st on CoinMarketCap's charts, have been very similar to those of Bitcoin SV and Cosmos. However, contrary to the aforementioned cases, a genuine surge was registered on VET's charts as the crypto climbed by almost 18% in just a week. In fact, despite corrections setting in, VET was still trading around its highest levels in 3 weeks.
VeChain's indicators, however, seemed to tell a starkly different story, with the effect of the ensuing corrections felt sharply by the Relative Strength Index and the Chaikin Money Flow. While the RSI noted a brief dip towards the oversold zone, the Chaikin Money Flow seemed to be heading towards zero, a sign of capital outflows gaining strength over capital inflows in the VeChain market.
It should also be noted that VeChain noted a brief surge a while back too after it was revealed that it was discussing a post-COVID 19 response with the Chinese government.
The post Bitcoin SV, Cosmos, VeChain Price Analysis: 19 November appeared first on AMBCrypto.
3y ago
bullish:
5
bearish:
0
Share


 Manage all your crypto, NFT and DeFi from one place
Securely connect the portfolio you’re using to start.

bullish:
0
bearish:
0

bullish:
0
bearish:
0

bullish:
0
bearish:
1

bullish:
0
bearish:
1