Bitcoin SV long-term Price Analysis: 30 November
3y ago
bullish:
0
bearish:
1
Share

Disclaimer: The findings of the following article are the sole opinion of the writer and should not be taken as investment advice
Bitcoin SV is a long way from its all-time high. While most altcoins are out of the bear market, Bitcoin SV, for some inexplicable reason, still seems to be in it. At press time, Bitcoin SV was trading at $172 with a market cap of $3.18 billion.
BSV seemed to be showing a slight bearish bias in the short-to-mid term scenario. On a 4-hour time frame, there seemed to be looming short-sellers nearby, whereas, a strong resistance on the daily time frame was found. Stuck between a rock and a hard place, BSV will have no place to go but down.
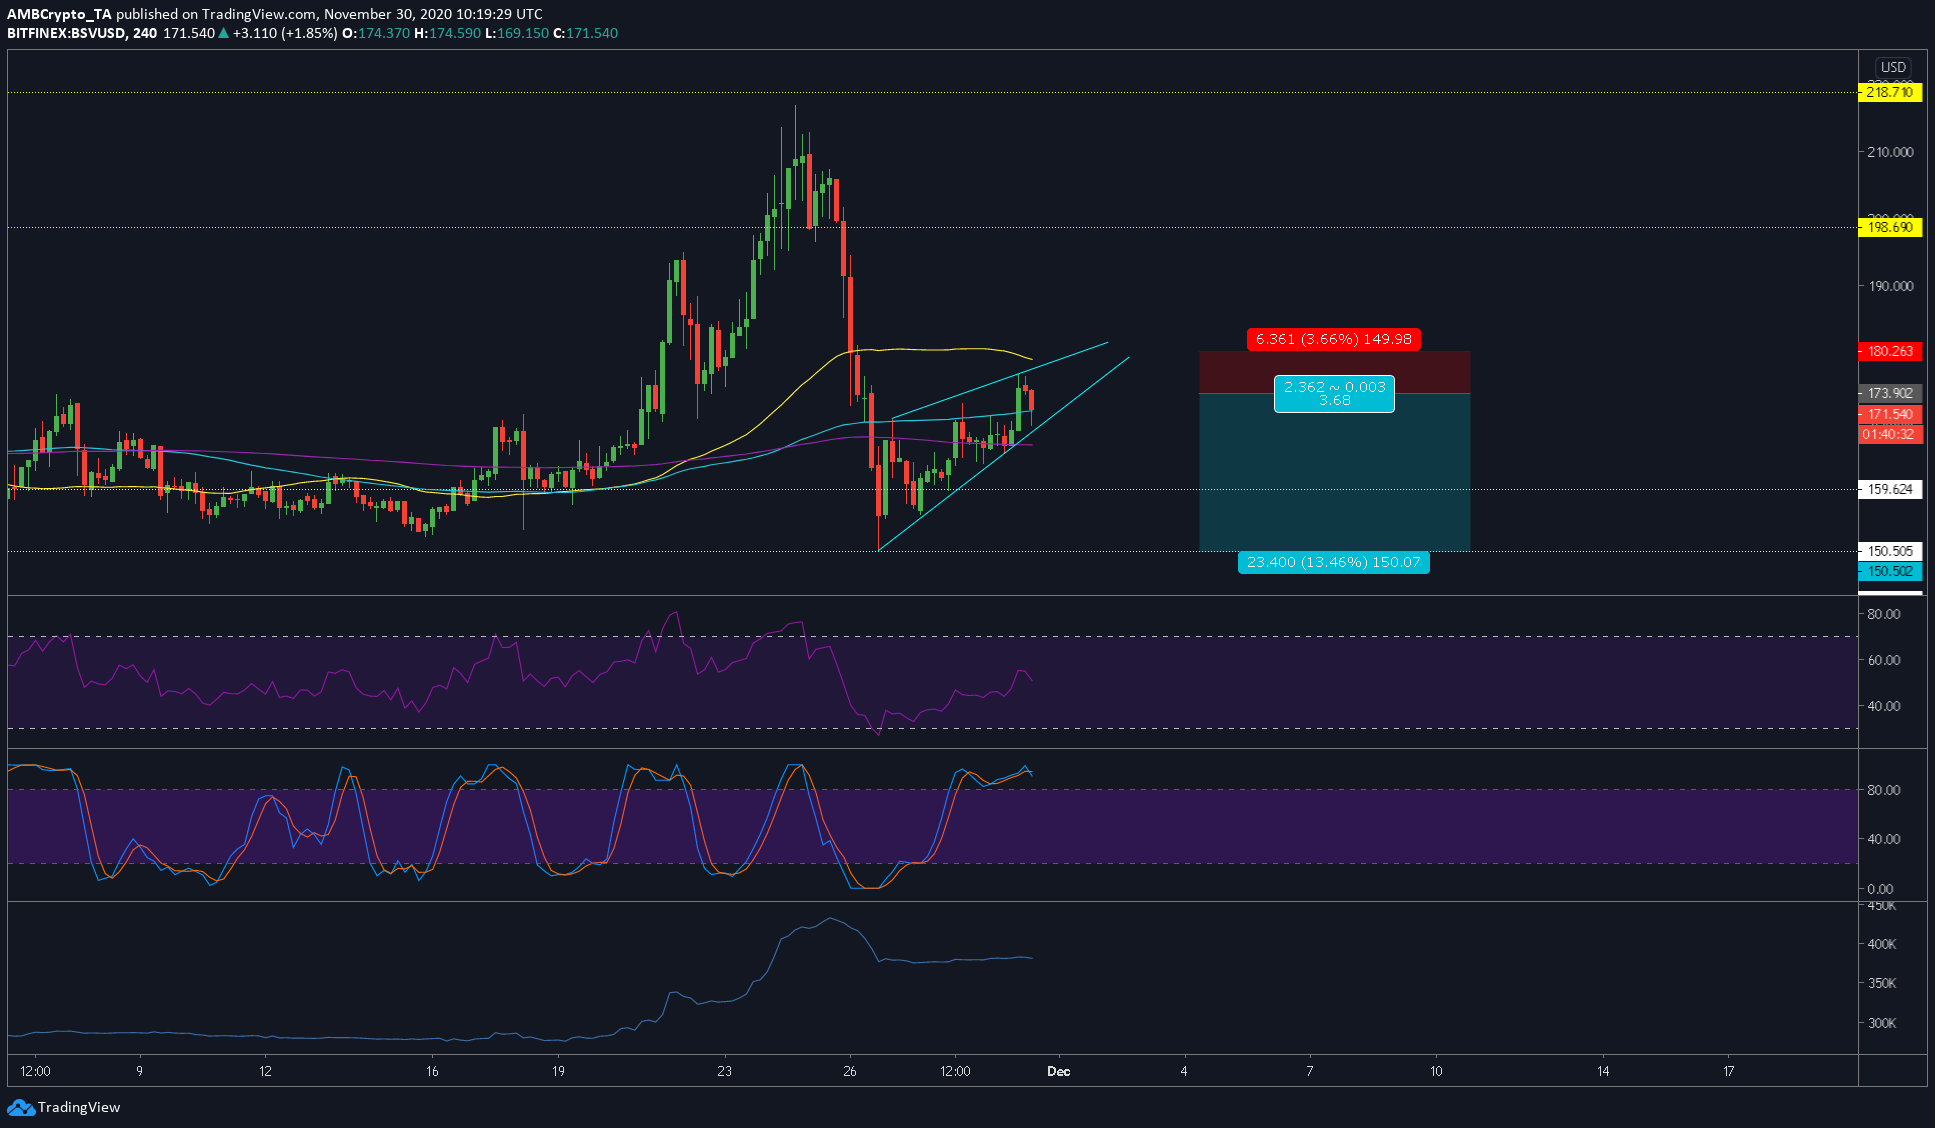
Bitcoin SV 4-hour chart
Source: BSVUSD on TradingView
The attached chart showed that Bitcoin SV was forming a rising wedge, an inherently bearish pattern. As explained above, the strong overhead resistance and the bearish pattern together pose a bearish outlook for BSV in the short-t0-medium term scenario. This would open up an opportunity for a short play on BSV.
Rationale
In addition to the above, there was a strong 200-day moving average at $180 acting as a deterrent to any bullish momentum. Despite the recent hike in price, the volume didn't seem to back it.
Moreover, the Stochastic RSI had already hit a bearish crossover in the overbought zone, a tell-tale sign of a reversal. Combining this with the RSI, which was also showing signs of reversal just above the 50-level, indicated that there will be a drop soon.
In fact, the price had already faced rejection at the 50-moving average on the 4-hour timeframe, a development that was a bearish sign.
Levels to look out for
Entry: $173.902
Stop-Loss: $181.000
Take-Profit: $150.502
Risk-to-Reward: 3.3
The take-profit level can be at the aforementioned level or a little higher, at $159, which would be the immediate support after the price breaks out of the rising wedge. This would yield an R of 2.2.
The post Bitcoin SV long-term Price Analysis: 30 November appeared first on AMBCrypto.
3y ago
bullish:
0
bearish:
1
Share


 Manage all your crypto, NFT and DeFi from one place
Securely connect the portfolio you’re using to start.

bullish:
0
bearish:
0

bullish:
0
bearish:
0

bullish:
0
bearish:
0

bullish:
0
bearish:
0