Ripple Price Analysis: XRP/USD Signals A Massive Spike On This Bullish Flag Pattern Formation
4y ago
bullish:
4
bearish:
0
Share

- Ripple price renews the bullish momentum after bouncing off support at $0.19.
- The formation of a bullish flag pattern hints towards a formidable XRP/USD rally past $0.20.
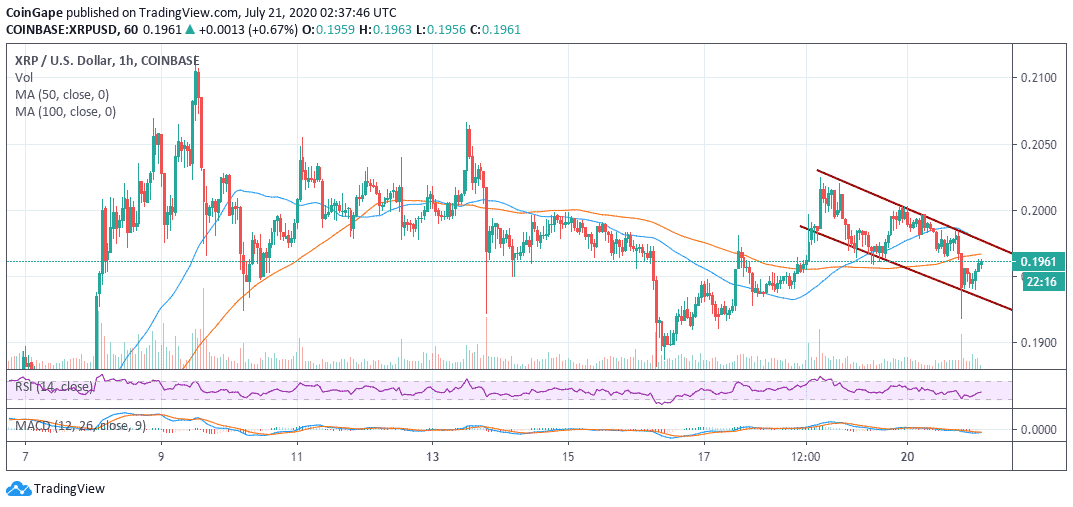
Ripple price is attempting to change the narrative that has dominated its market since it hit a hurdle at $0.21 in the first week of July. XRP rallied impressively from lows under $0.17 in tandem with the spike witnessed in various altcoins. Unfortunately, the fourth-largest cryptocurrency failed to contain the gains above $0.20. The price was pivotal at $0.20 for some time before a Pandora box opened with XRP/USD dumping to levels marginally under $0.19.
Related reading: Bitcoin Price Stability Holds As Altcoins Signal “Range Dump” After Rally
The weekend session experienced some impressive bullish actions with XRP stepping slightly above $0.20. Generally, the trading has been lethargic across the market with Ripple losing the ground above $0.20. Moreover, the losses corrected below the moving averages.
At the time of writing, Ripple is trading at $0.1965. Bulls seem to be having a difficult task breaking the resistance at the 100 Simple Moving Average (SMA) on the 1-hour chart. On the bright side, a bullish momentum appears to be building towards $0.20 as long as the seller congestion at the 100 SMA and the 100 SMA is overcome.
XRP/USD 1-hour chart
Ripple Price Bullish Scenario
Ripple is mainly in the hands of the bulls even though price actions are not as rapid as investors would want. The ongoing bullish momentum is supported by the RSI’s upward sloping movement. In addition, the MACD is closing in on the midline with the potential of crossing into the positive region.
The icing of the cake is the formation of a short term bullish flag pattern. A pattern like this usually points to a bullish action following a bearish trend. In this case, if supported by the right volume, a breakout above the pattern could catapult Ripple higher above $0.20.
Read more: Ripple’s ODL Service In Australia Records Low Liquidity
Ripple Key Intraday Levels
Spot rate: $0.1965
Relative change: 0.0016
Percentage change: 0.82%
Trend: Bullish
Volatility: Expanding
4y ago
bullish:
4
bearish:
0
Share

 Manage all your crypto, NFT and DeFi from one place
Securely connect the portfolio you’re using to start.

bullish:
0
bearish:
0

bullish:
0
bearish:
0

bullish:
0
bearish:
0

bullish:
0
bearish:
0