Cardano long-term Price Analysis: 29 November
3y ago
bullish:
3
bearish:
0
Share

Disclaimer: The findings of the following article are the sole opinion of the writer and should not be taken as investment advice
Cardano recorded a stark surge in its price, despite its drop of 30% following Bitcoin's correction on the charts. Altcoins are the ones that suffer the most due to Bitcoin's volatility and the same has been true in ADA's case.
However, what's different is that Cardano's bounce since the drop - the 30% drop - was almost fully retraced over the next 2 days. This underlined the strong buyback for ADA, one that was backed by a good volume surge on the charts.
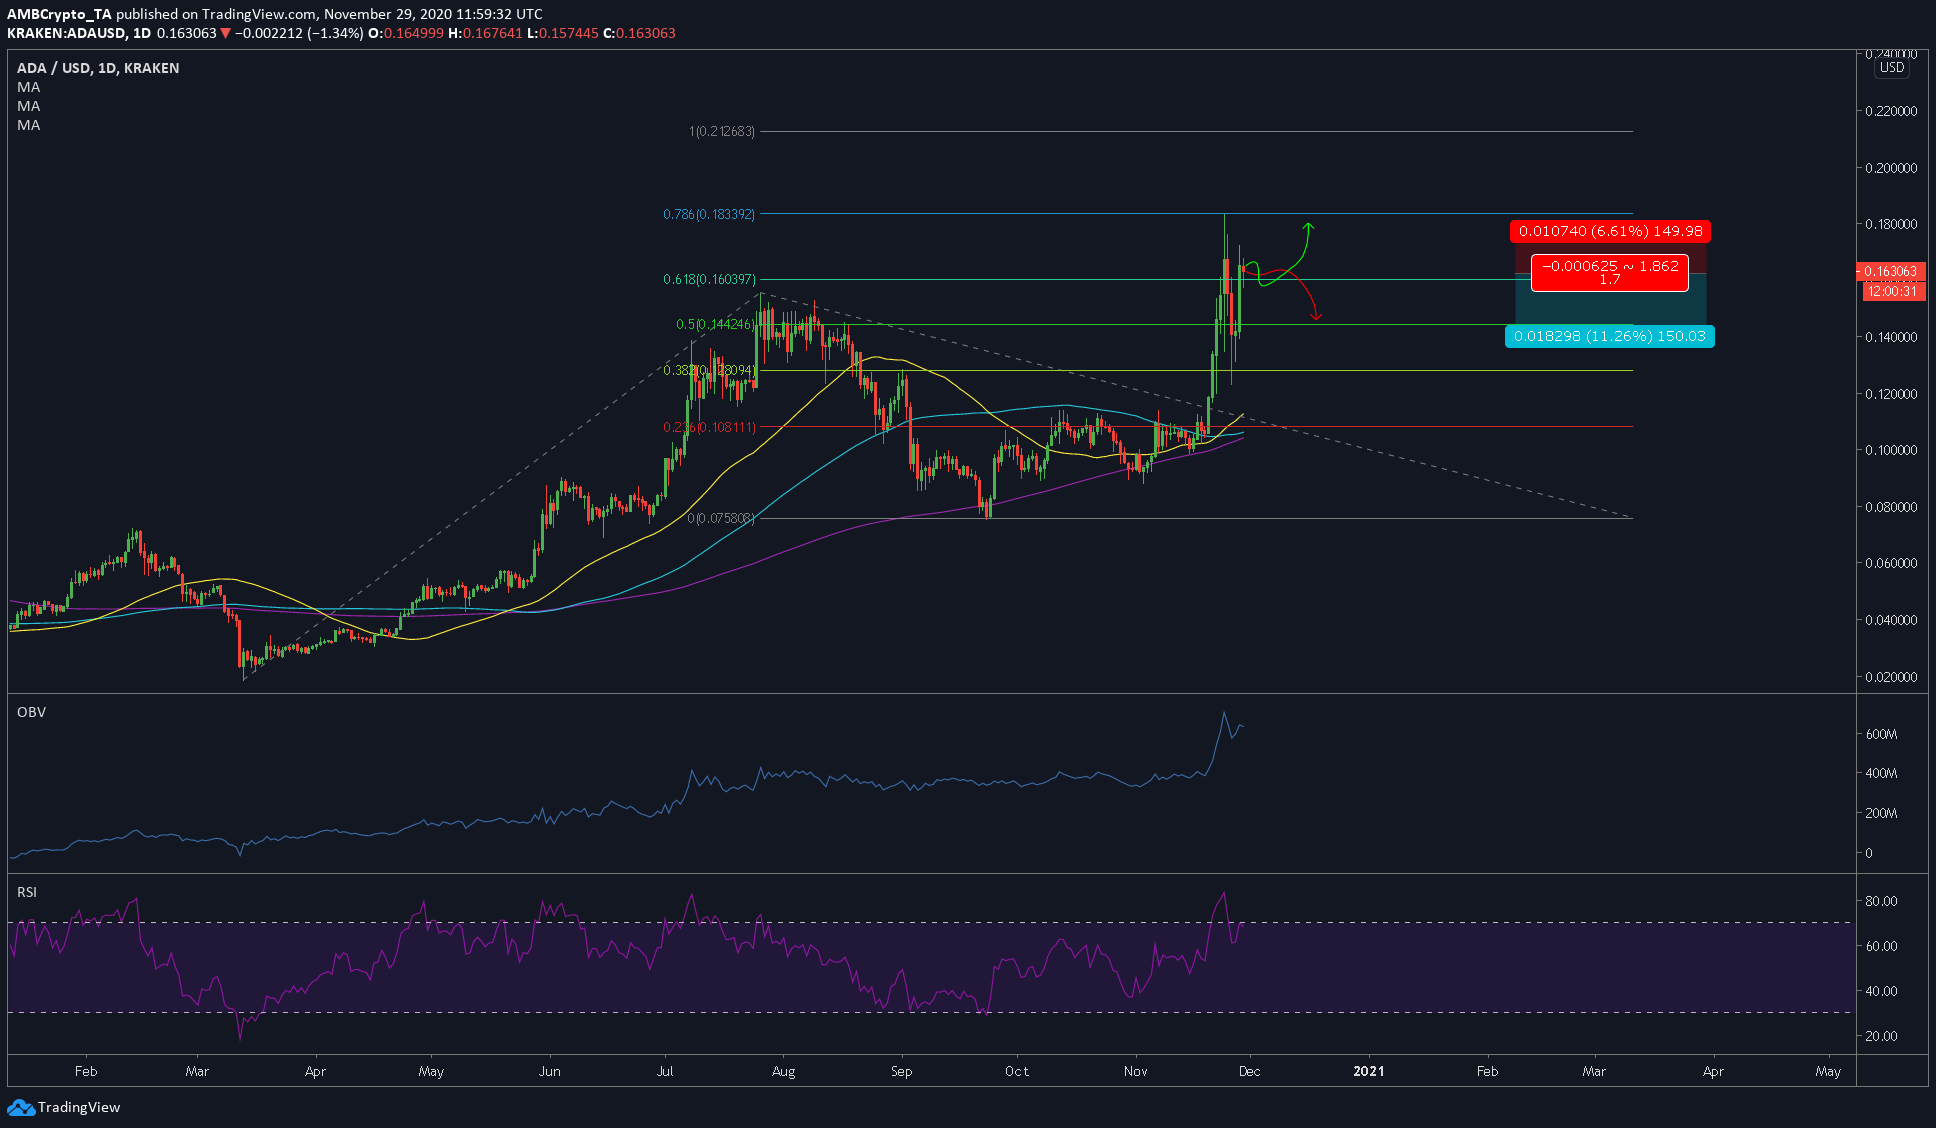
At the time of writing, ADA's outlook seemed 50-50. The cryptocurrency's price was just above the 61.8%-Fibonacci level and could go either way.
Cardano 4-hour chart
Source: ADAUSD on TradingView
The 4-hour chart had Fib extensions, the moving averages, and indicators to it. While there was no pattern to it, ADA's chart seemed eager to surge higher. A bounce from the 61.8% level could take ADA higher. However, failure to respect this level could push ADA down to the 50% level, which was at $0.1442.
Rationale
Since the odds seemed equally skewed, considering ADA's correlation with BTC might help break it. At press time, the 60-day correlation between ADA and BTC had surged from 0.276 to 0.50.
Such a stark surge in correlation meant that ADA will promptly follow where Bitcoin goes. Since Bitcoin did show a bearish outlook, we can expect ADA to head south as well.
Additionally, there was the confluence of moving averages 50, 100, and 200. There hadn't been a reversion to the mean between the price and these MAs. Hence, this supported the bearish scenario.
The OBV indicator showed a good surge in volume for the second wave, however, it still seemed to be lower than the previous surge. The RSI was testing the overbought zone yet again. A failure at this level would be higher, hence, a short position will make sense.
Levels to look out for
Entry: $0.162438
Stop-loss: $0.173178
Take-profit: $0.144140
Risk-to-Reward: 1.7
The post Cardano long-term Price Analysis: 29 November appeared first on AMBCrypto.
3y ago
bullish:
3
bearish:
0
Share


 Manage all your crypto, NFT and DeFi from one place
Securely connect the portfolio you’re using to start.

bullish:
0
bearish:
0

bullish:
0
bearish:
0


bullish:
0
bearish:
0