Binance Coin price rises above $18: what’s next?
4y ago
bullish:
1
bearish:
0
Share

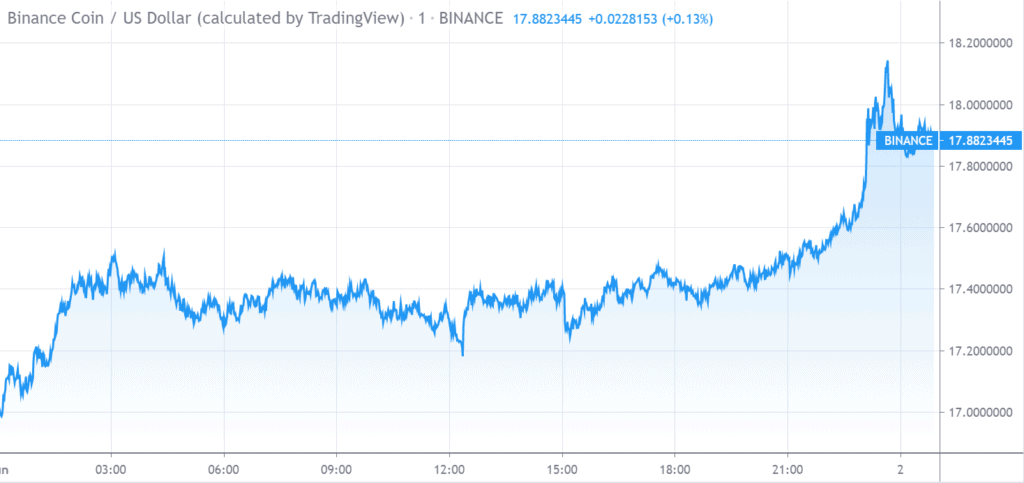
The Binance Coin price line appeared bullish towards the end of the 1st of June after the cryptocurrency exhibited trade about the $17.40 level through most of the day.
The BNBUSD trading pair stayed within a day’s range of $17.0577747 — $18.1126924.
1-Day Binance Coin price analysis (1st June)
 Binance Coin Price Chart by Trading View
The cryptocurrency saw an uptrend after 21:00 GMT on the 1st of June, after which it rose across the $18.00 mark. BNBUSD approached a day’s high of $18.1126924, while it traded at $17.8823445 US Dollars at the time of writing.
Binance Coin: what’s next?
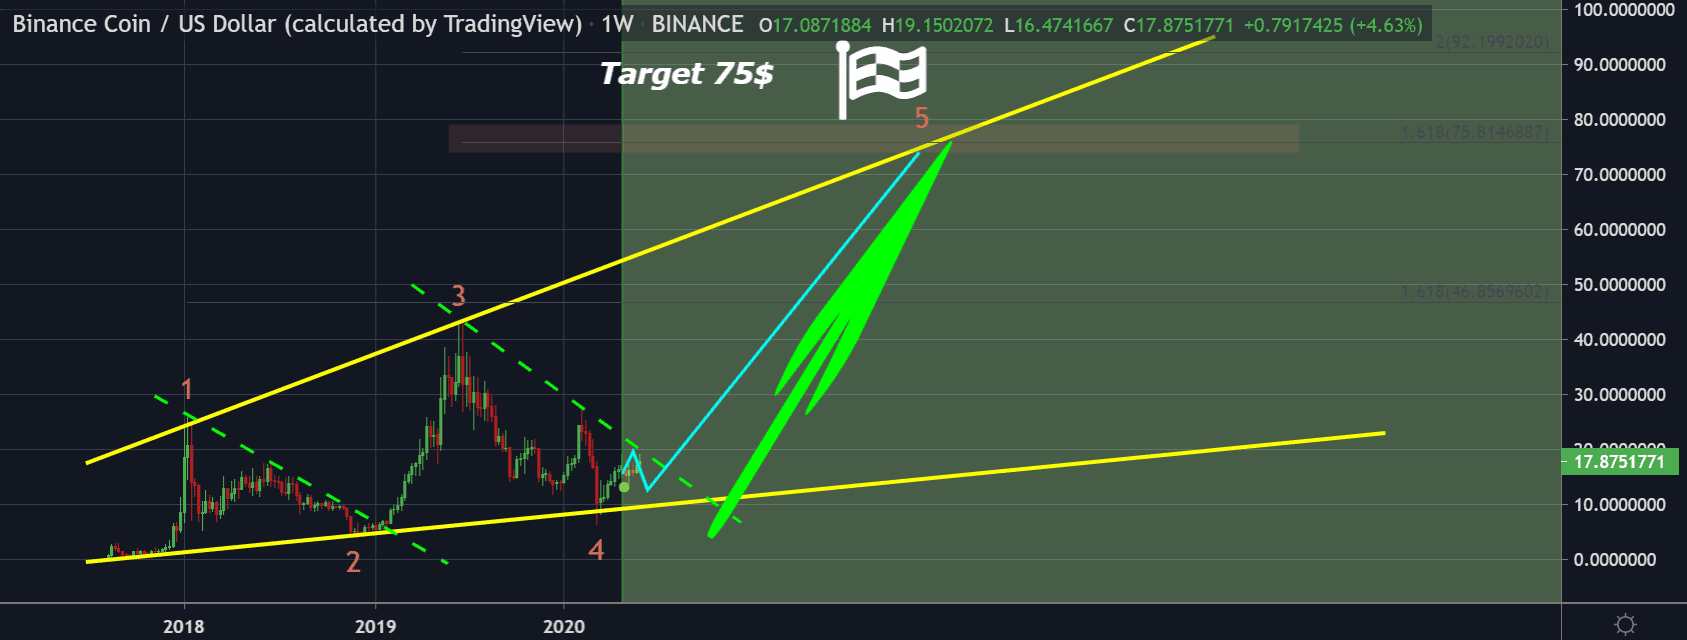
AnonymousTraderAcademy is a TradingView analyst who has drawn an idea for the BNBUSD pair. The analyst has suggested that BNB will see a price target above the $70.00 mark for a long trade.
 Binance Coin Price Chart by Trading View
The analyst marked the Return on Investment to be 500%. The trading pattern appears to be of a broadening wedge, while the BNBUSD pair has shown to have followed some of the expected trajectory drawn by the analyst on the chart for the idea. If this trade completes, the price target of $75 will be met by Binance Coin.
Binance Coin: technical indicators
 Binance Coin Price Chart by Trading View
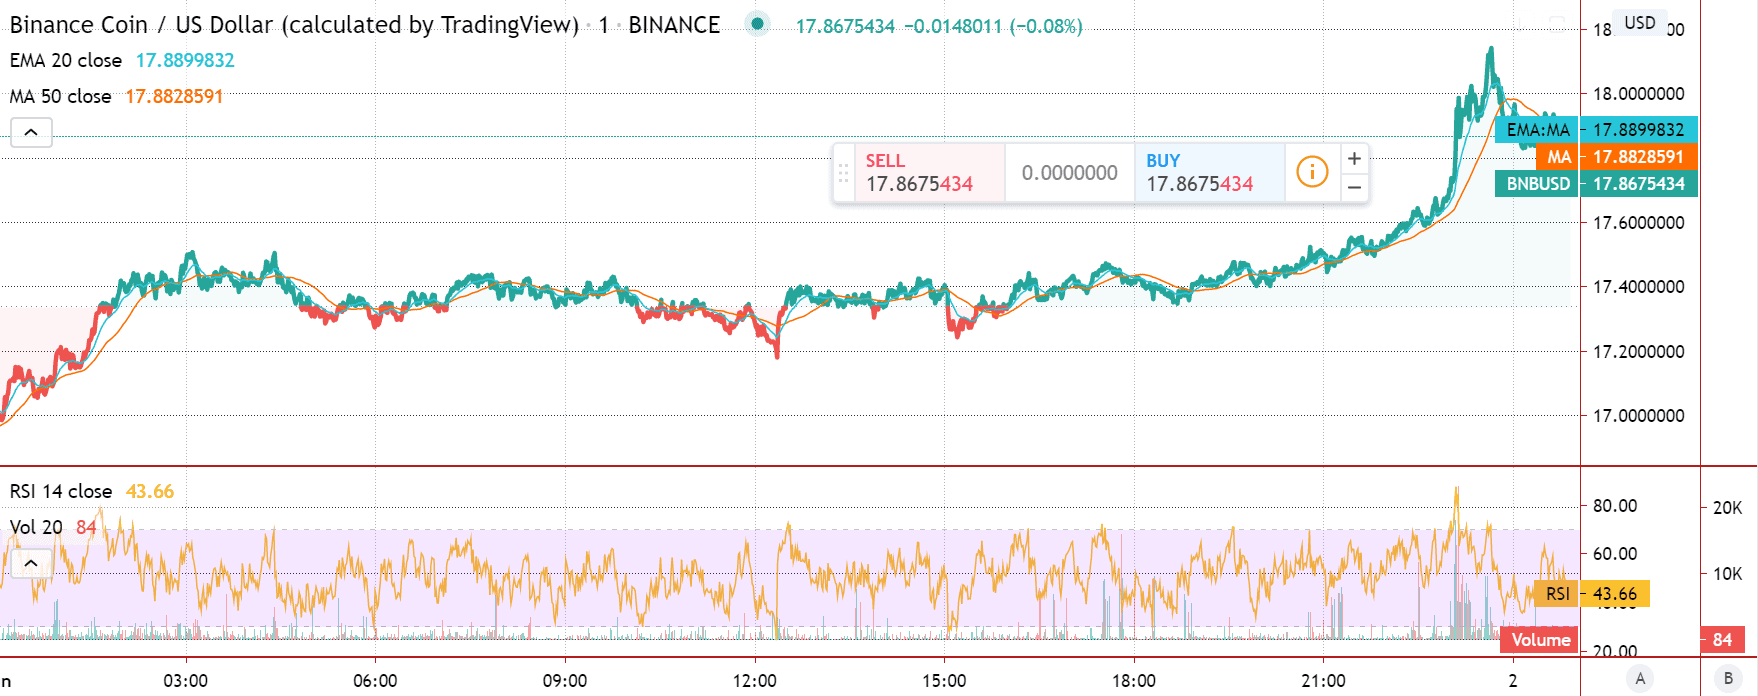
The moving average technical indicators were observed near the $17.40 level through most of the day’s trade. The BNBUSD pair began moving upwards after stepped onto the day with a price near the $17.00 level. After 21:00 GMT the cryptocurrency a more significant uptrend, where the price moved above the $18.00 mark. The 20-Day Exponential Moving Average (EMA) closed at $17.8899832, while the 50-Day Moving Average (MA) closed at $17.8828591.
The Relative Strength Index (RSI) rose to a high of 89.00 at 23:05 GMT, when Binance Coin observed an uptrend. This depicts that Binance Coin was overbought at the time. At the time of writing, the RSI was observed at 43.66.
Disclaimer: The information provided is not trading advice but an informative analysis of the price movement. Cryptopolitan.com holds no liability towards any investments based on the information provided on this page.
4y ago
bullish:
1
bearish:
0
Share


 Manage all your crypto, NFT and DeFi from one place
Securely connect the portfolio you’re using to start.

bullish:
9
bearish:
0