Top 3 Coins to Watch Price Analysis - Fetch.AI, OKB and Matic
4y ago
bullish:
5
bearish:
2
Share
Top 3 coins price analysis
This week we had released an article suggesting three top coins for you to watch this week, April 20th - 26th.
Following is some technical analysis on these coins.
1. Fetch.AI price analysis
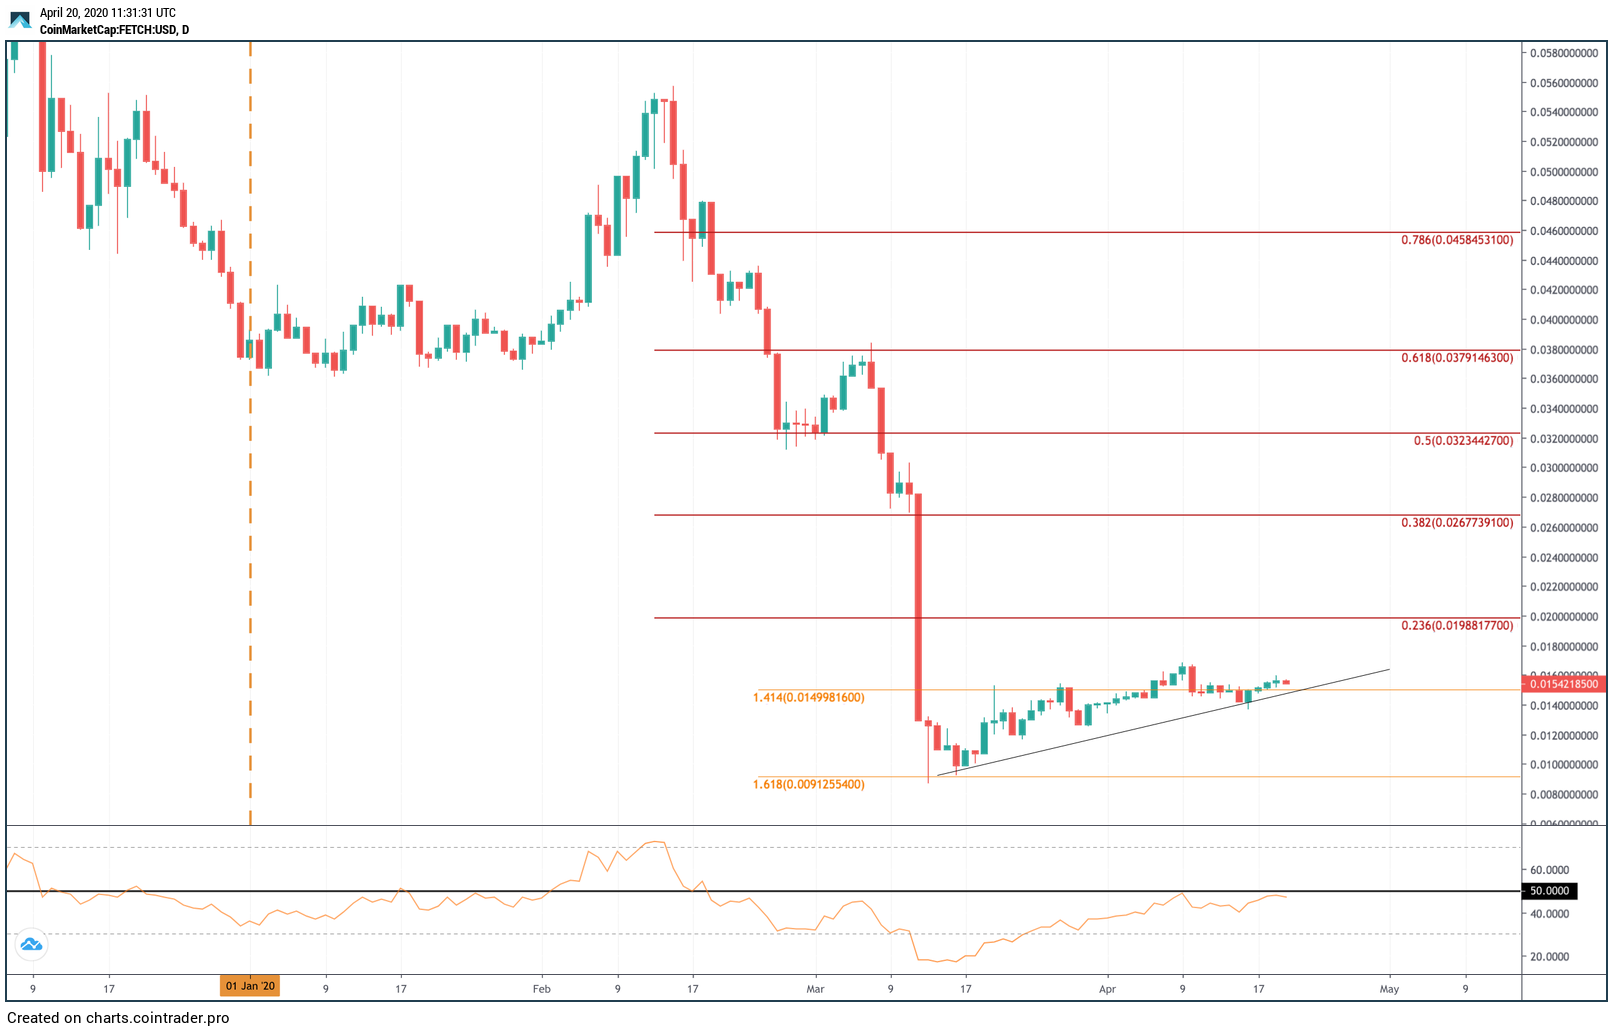
FET has seen a small 5% price increase over the past 24 hours of trading, however, this does not change the fact that the cryptocurrency had previously dropped by a total of 86% from high to low in 2020 alone!
Fetch.AI had dropped from a high of around $0.056 in February and plummetted as low as $0.01 in March, where it managed to find some support at a short term downside 1.618 Fibonacci Extension level. Of course, this price decline was apparent throughout the entire cryptocurrency market, however, the price drop of FET was quite substantial.
After rebounding from $0.01, the cryptocurrency started to slowly climb higher. IT quickly managed to reach $0.015 by the end of March and went on to climb slightly higher during April to reach the $0.017 level.
The cryptocurrency is also trading above a rising support trend line and had recently bounced from here last week.
However, it is important to point out that the price rebound from Fetch is quite weak when compared with price increases in the majority of other altcoins.
Looking ahead, if the buyers can push higher and break above the $0.017 resistance, the first level of higher resistance is located at $0.02, where lies the bearish .236 Fib Retracement - measured from the Feb high to the March low.
Above this, resistance is located at $0.022, $0.025, and $0.0267 (bearish .382 Fib Retracement level).
On the other hand, if the sellers step in and push the market lower, the first level of support is located at $0.015. Beneath this, we can expect support at $0.014, $0.012, and $0.01.
The RSI has been climbing from extremely oversold conditions, however, it is struggling to break above the 50 line which is a strong signal that the sellers are not ready to give up their control of the market momentum just yet.
How to buy Fetch.ai on Binance?
2. OKB price analysis
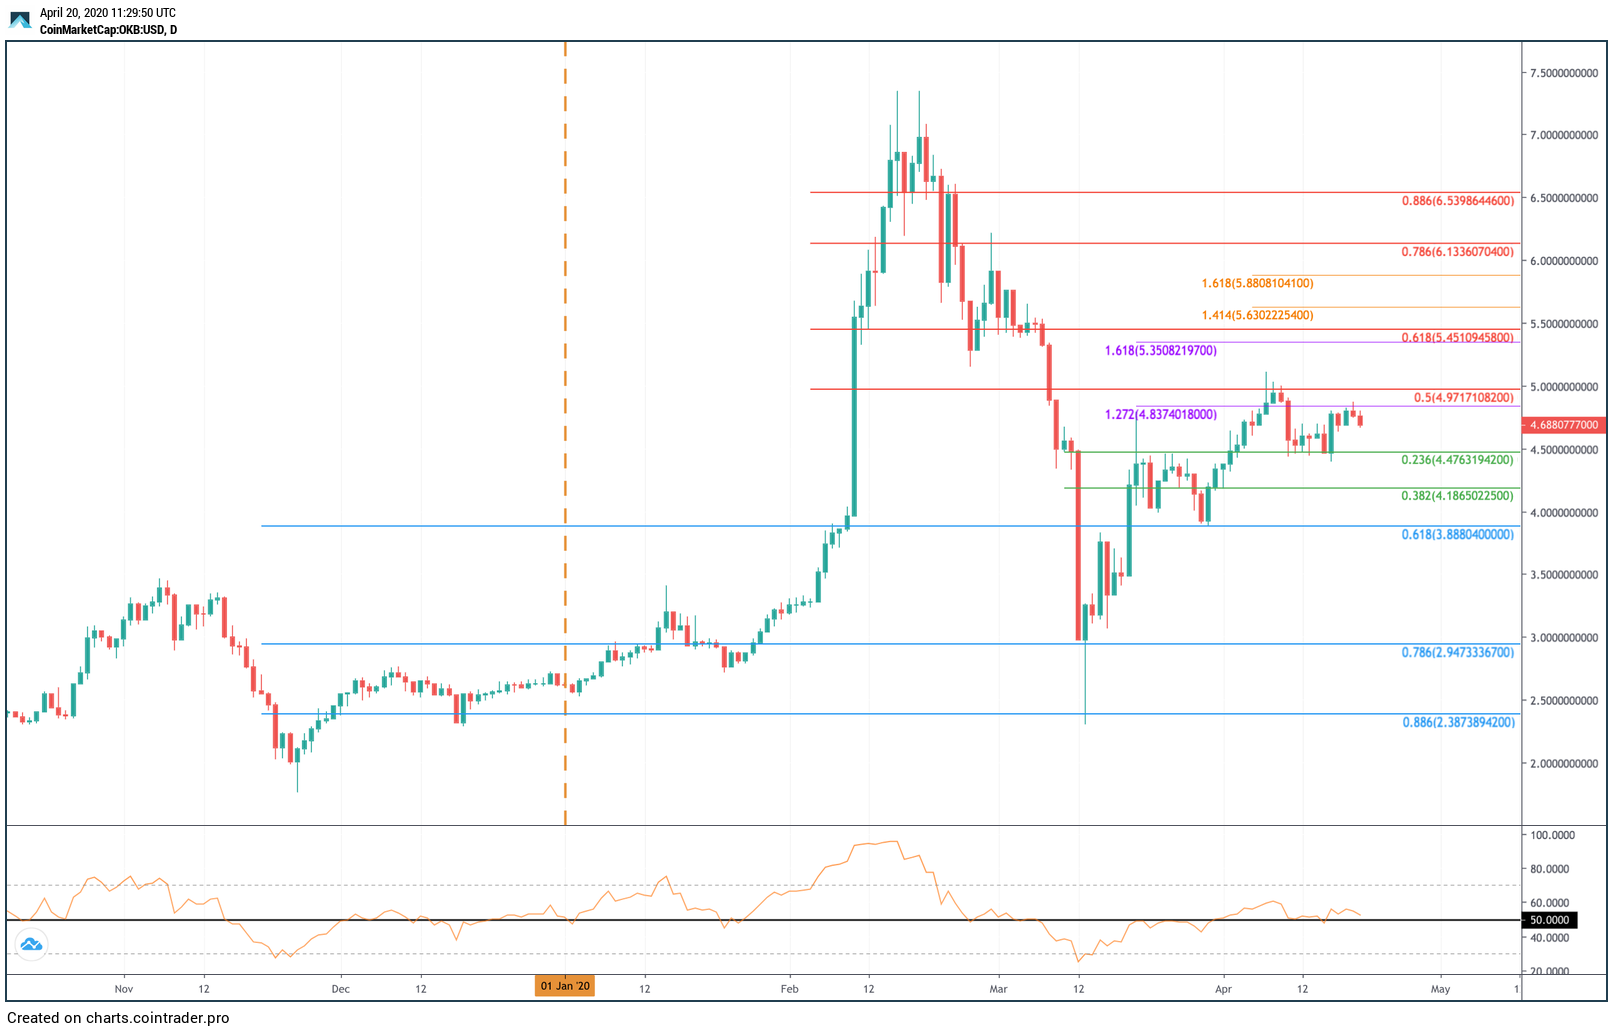
OKB has seen an interesting period of trading in 2020. The cryptocurrency actually increased by a total of 185% in the first 6 weeks of the year as it surged into the $7.30 level by mid-February. However, during the March market collapse, the cryptocurrency started to drop heavily. IT plummetted beneath support at $5 and $4 and continued to drop until finding support at $2.94 which is provided by the long term .786 Fibonacci Retracement level.
After reaching this support, we can see that OKB went on to rebound higher as it managed to climb as high as $4.50 by the end of March 2020.
During April, we can see that OKB went on to climb higher above $4.50 as it increased to reach the resistance at the $4.97, provided by a bearish .5 Fib Retracement level. This bearish Fibonacci Retracement level is measured from the Feb high to the March low. It has since dropped lower from here but managed to find short term support at $4.47.
OKB is now facing strong resistance at $4.83 (1.272 Fib Extension) and has turned away from here recently.
Looking ahead, if the sellers push lower, the first level of support is located at $4.50 (.236 Fib Retracement). Beneath this, support lies at $4.18, $4.00, $3.88 (long term .618 Fib Retracement), and $3.50.
On the other side, if the bulls can break the resistance at $4.83, higher resistance lies at $4.97. Above this, resistance is located at $5.35 (1.618 Fib Extension), $5.45 (bearish .618 Fib Retracement), $5.63, $5.88, and $6.00.
The RSI is trading on the 50 line which is is a sign of indecision within the market.
3. Matic price analysis
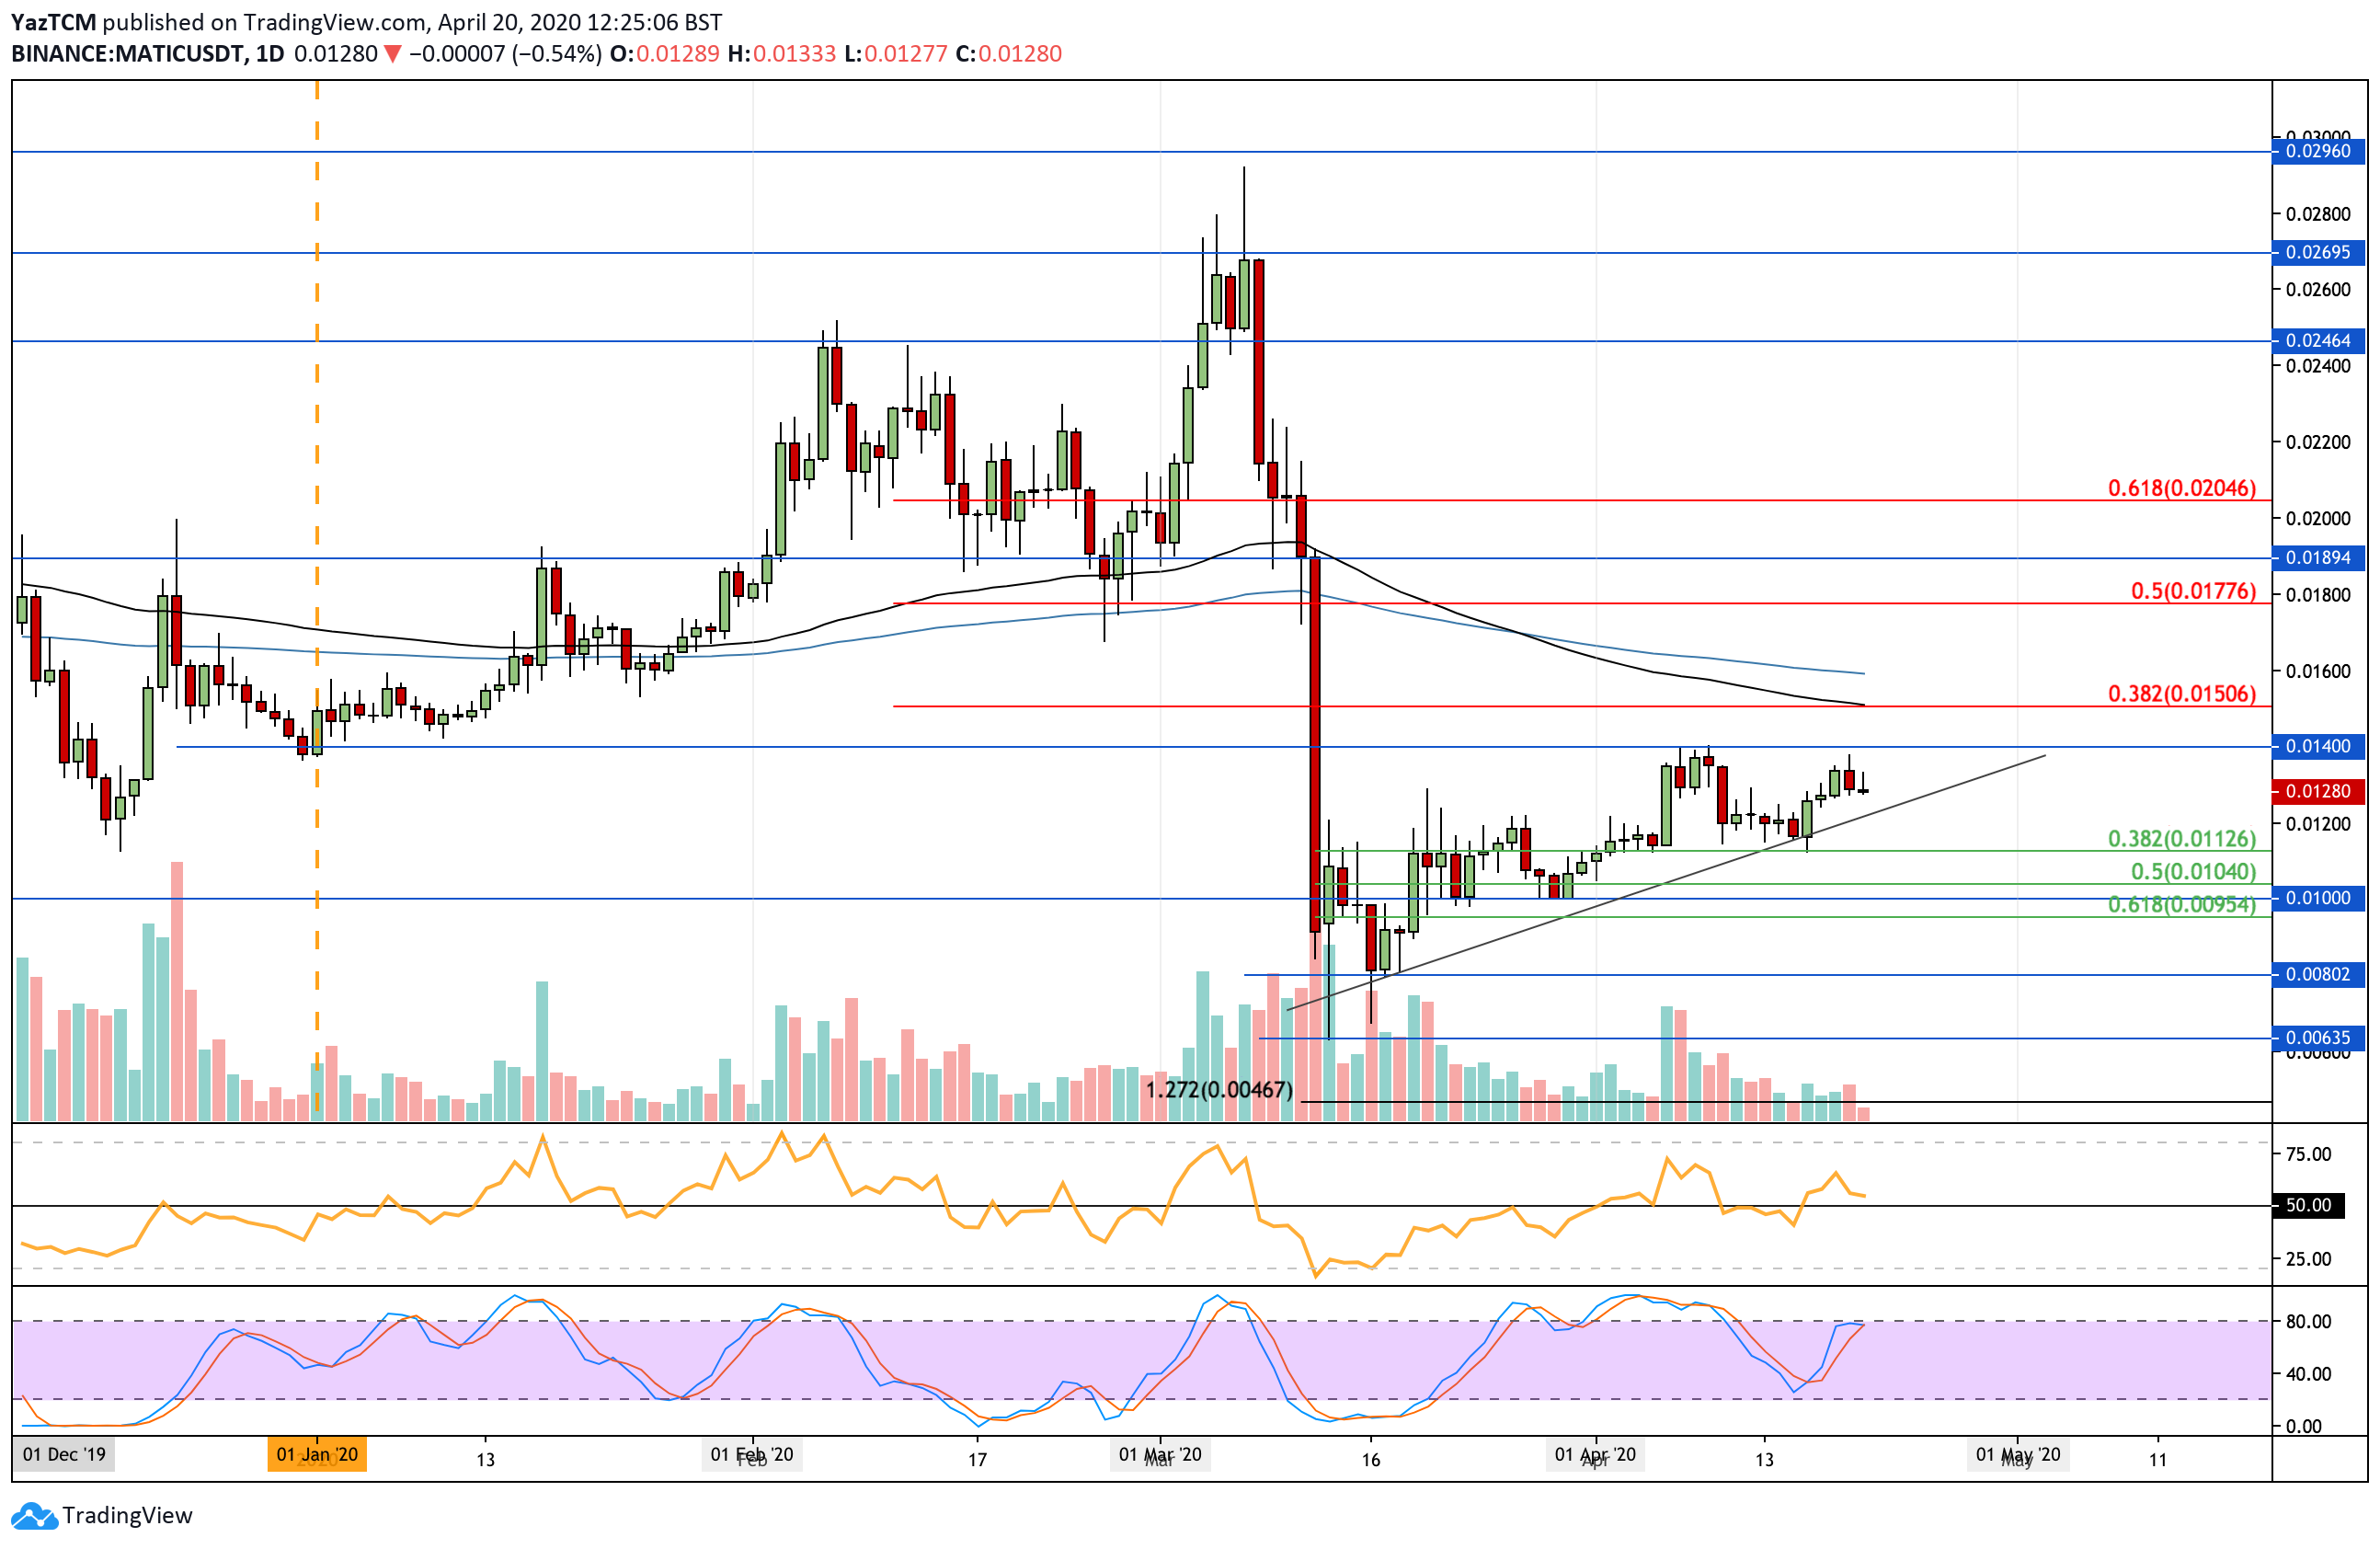
Matic has actually seen a strong 9% price increase over the last 7-days of trading as the cryptocurrency trades at the $0.0128 level. Matic increased from January through March as it managed to reach a high-day closing price of around $0.027 in early March 2020.
However, during the March market collapse, we can see that Matic slipped lower as it dropped into the support at $0.00635. It managed to rebound from here and reached as high as $0.012 before the end of March 2020.
In April, Matic went on to climb even higher as it reached resistance at $0.014. It dropped lower but managed to find support at the .382 Fib Retracement at $0.0112 and the rising support trend line.
Looking ahead, if the bulls can break the resistance at $0.014, higher resistance is located at $0.015 where lies the 100-day EMA. This resistance is further bolstered by a bearish .382 Fib Retracement level that is measured from the March high to the March low. Above this, resistance is located at $0.016 (200-day EMA), $0.01776 (bearish .5 Fib Retracement), $0.0189, and $0.02.
On the other hand, the first level of support lies in the rising support trend line. Beneath this, support lies at $0.0112 (.382 Fib Retracement), $0.010 (.5 Fib Retracement), and $0.01.
The RSI is slightly above the 50 line to show weak bullish momentum. We would need to see it rise higher if we would like to see Matic breaking the $0.14 resistance level.
Buy/Sell Matic Network (MATIC)
How to buy Matic Network on Binance?
Previous Top Coins to Watch analysis
At CoinCodex, we regularly publish price analysis articles focused on the top cryptocurrencies. Here's our most recent article about the price of Top Coins to Watch:
4y ago
bullish:
5
bearish:
2
Share


 Manage all your crypto, NFT and DeFi from one place
Securely connect the portfolio you’re using to start.

bullish:
0
bearish:
0

bullish:
0
bearish:
0

bullish:
0
bearish:
0

bullish:
0
bearish:
0