Binance Coin, Polkadot, Uniswap Price Analysis: June 17
3y ago
bullish:
1
bearish:
0
Share
The altcoin market saw an 8% rise in market cap as most alts remained relatively volatile. Binance Coin, Polkadot, and Uniswap saw a dip in their price on June 15 and were gaining momentum, depicting slight gains. While the volatility for these three alts was low, a slight gain in price can lead to increased market action for these alts.
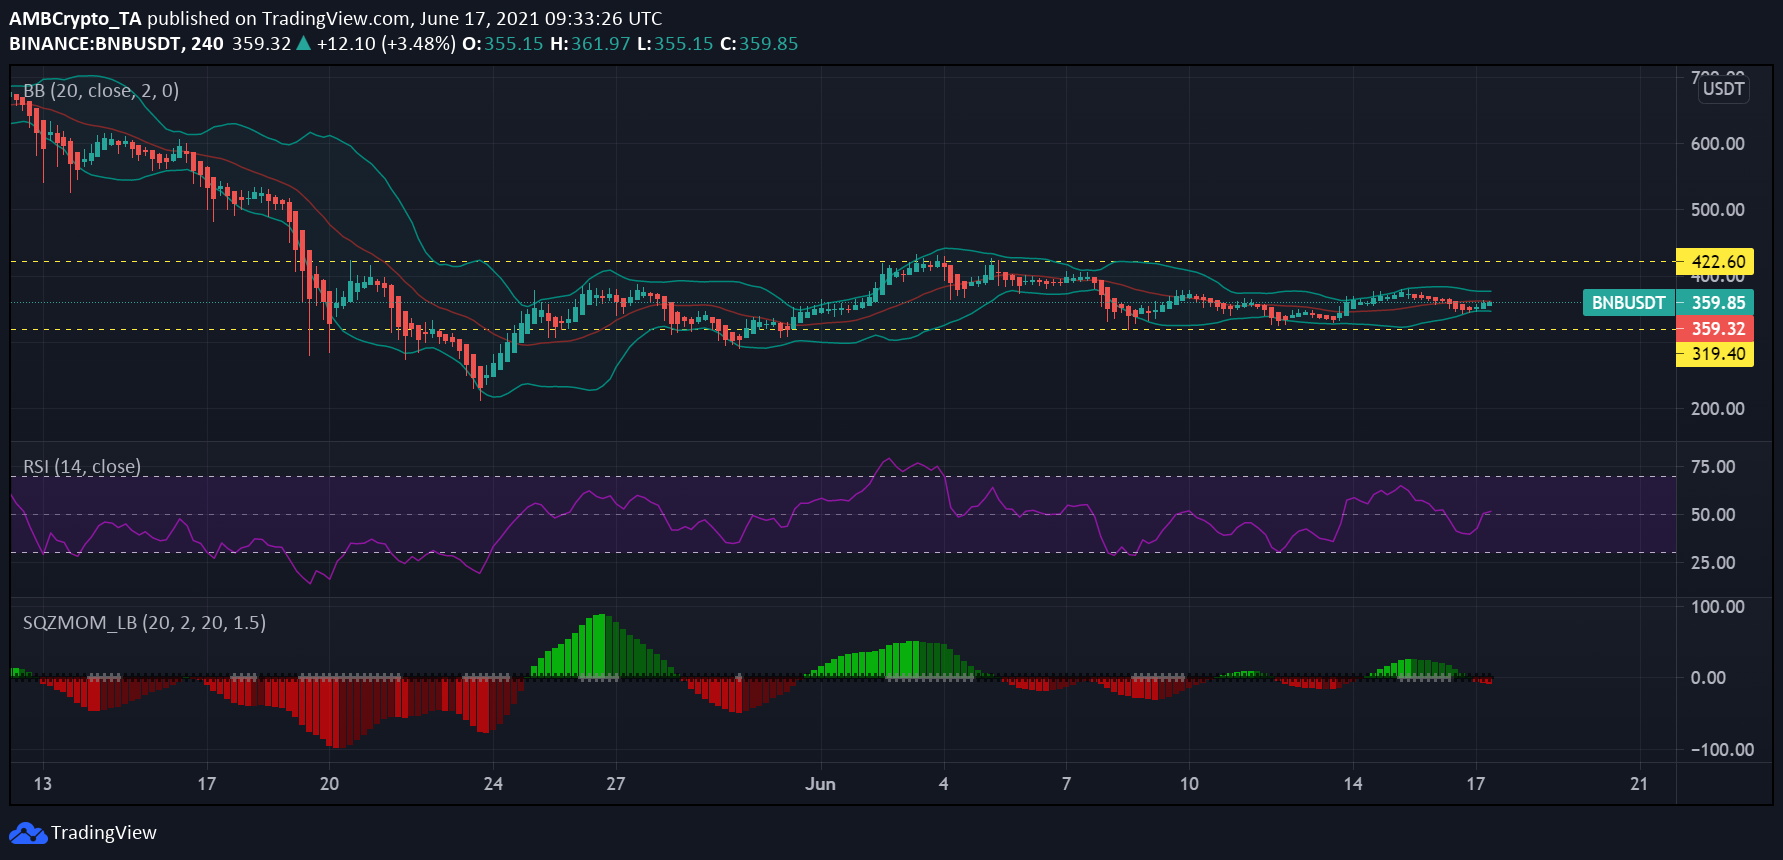
Binance Coin [BNB]Source: BNB/USD – TradingView
The fourth-largest crypto by market cap, BNB, was trading at $359.5 at press time and was down from its ATH by 47.45% which was 38 days ago. BNB traded within its closed channel since the May 19 drop, occasionally testing its support at $319.4. The coin’s key resistance was at $422.6, at the time of writing.
Bollinger Bands for the asset were constricted, underlining a restricted price range and volatility. Further, Squeeze Momentum indicator displayed a bearish trend for BNB.
Relative Strength Index (RSI) noted a reading of 51.6 at press time and was in the neutral zone. Since the indicator maintained itself above the 50-mark, it pointed to rising buying pressure in place.
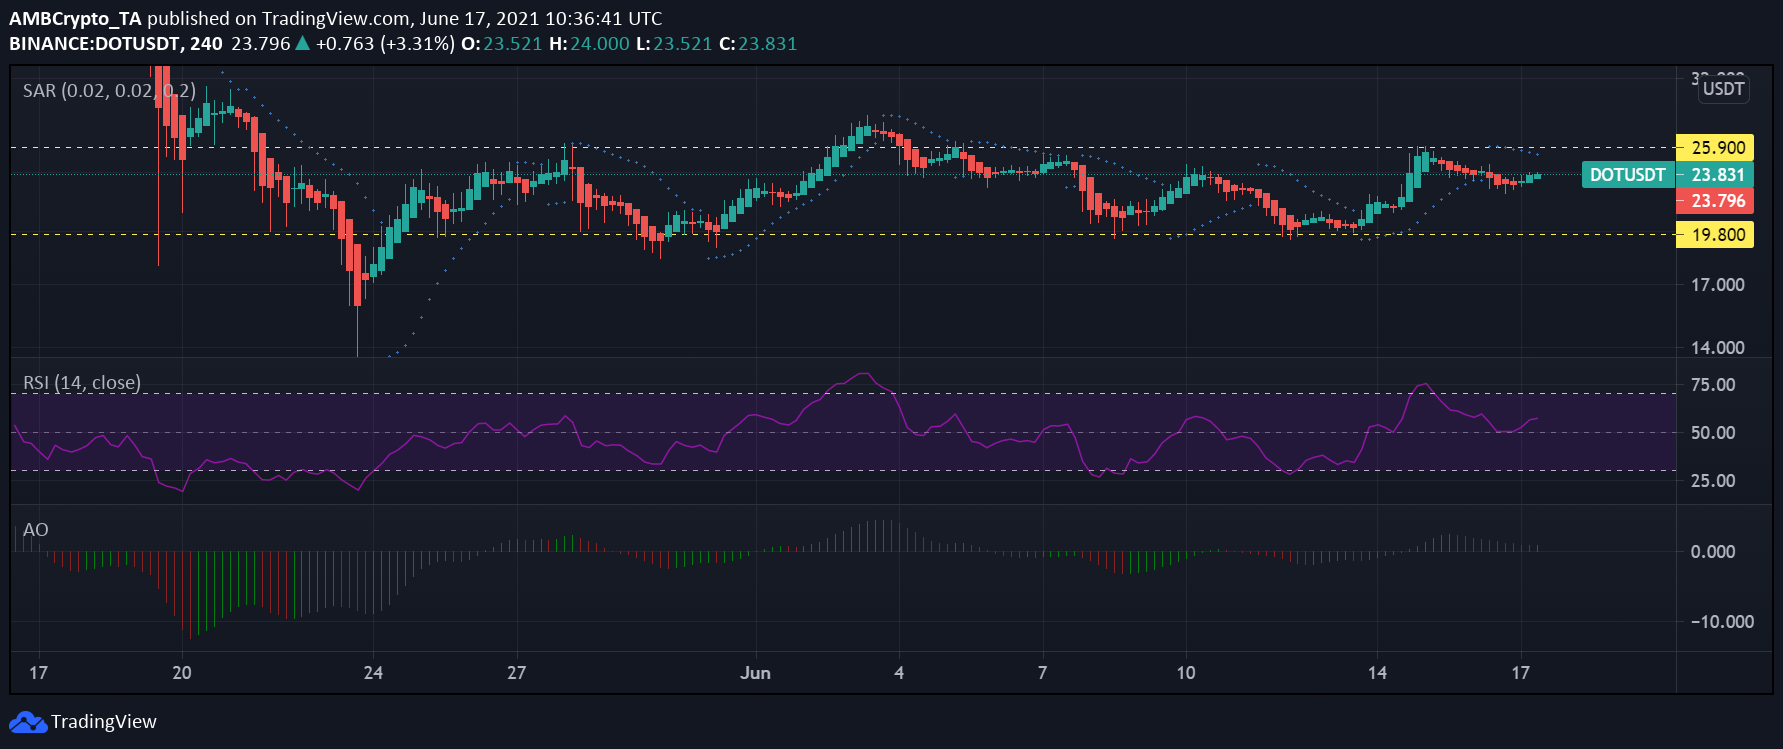
Polkadot[DOT]Source: DOT/USD – TradingView
Amid recent updates on the Polkadot ecosystem, Parallel Finance raised $2 million to make decentralized finance (Defi) a bigger part of the ecosystem. DOT fell by almost 9% since June 14 and traded at $23.8 at press time.
Parabolic SAR’s dotted lines above the candlesticks on a 4-hour chart for DOT highlighted a bearish trend. Relative Strength Index (RSI) noted a reading of 57.4 at press time and was in the neutral zone. However, the indicator maintained itself above the 50-mark and pointed to more dominant buying pressure for the alt.
The appearance of green candlesticks on a 4-hour chart indicated a price rise for the alt which corresponded to the rise of a green candle as shown by Awesome Oscillator. This pointed towards a moderately bullish momentum creeping in. If the price of DOT rose up it might test the resistance mark at $25.9.
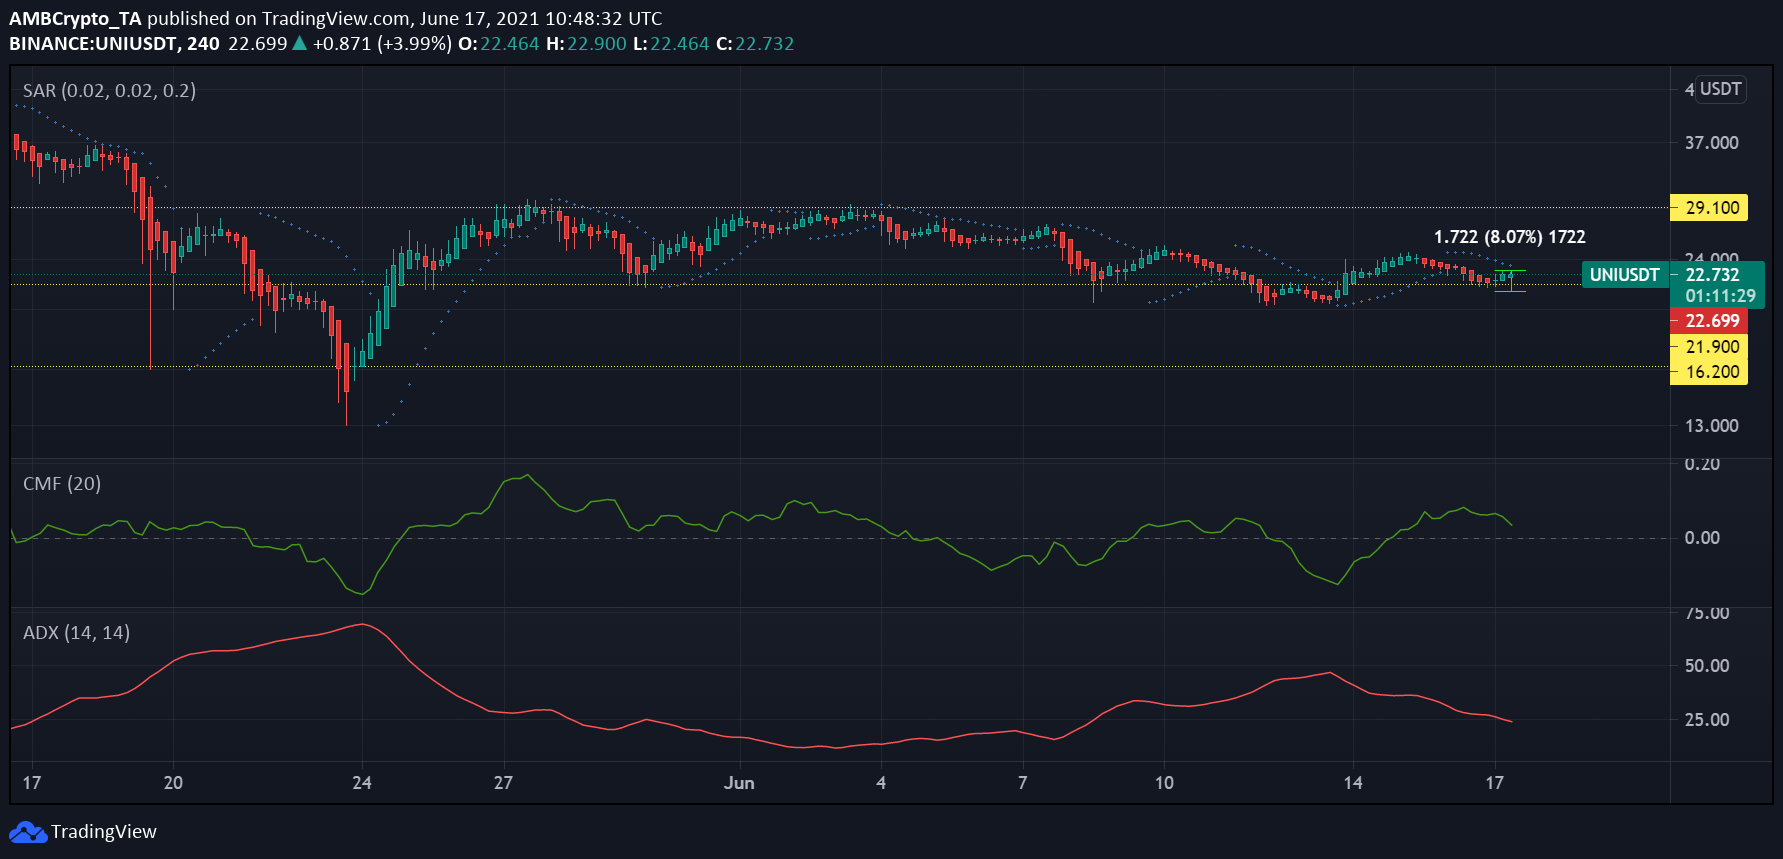
Uniswap [UNI]Source: UNI/USD – TradingView
UNI saw an 8% price rise in just one day while the asset had an 8.24% dip in the last week. Recoveries for UNI were quick, however, the bearish momentum was still prevalent as highlighted by Parabolic SAR’s dotted lines above the candlesticks on a 4-hour chart for the asset.
Capital inflows for the asset saw a slight downfall as the indicator showed a downtick at press time according to Chaikin Money Flow.
Further,= Average Directional Index (ADX) was below 25.0 highlighting a less directional market and absence of any prominent trend. The asset clung close to the support at $21.9 at press time.
The post Binance Coin, Polkadot, Uniswap Price Analysis: June 17 appeared first on AMBCrypto.
3y ago
bullish:
1
bearish:
0
Share


 Manage all your crypto, NFT and DeFi from one place
Securely connect the portfolio you’re using to start.

bullish:
0
bearish:
0

bullish:
0
bearish:
0

