XRP Price Analysis - XRP Falls 15% This Week As Sellers Dominate Market Momentum
4y ago
bullish:
0
bearish:
0
Share
Key Highlights:
- XRP fell by a total of 7.36% over the past 24 hours of trading, bringing the price for the cryptocurrency down to $0.273
- XRP also dropped against Bitcoin as it penetrates beneath the 100-day EMA.
| ⠀Ripple price: | $0.271 |
|---|---|
| ⠀Key XRP resistance levels: | $0.275, $0.28, $0.286, $0.29, $0.30 |
| ⠀Key XRP support levels: | $0.268, $0.265, $0.26, $0.254, $0.251 |
*Price at the time of writing
XRP dropped by a total of 7% over the past 24 hours of trading as the cryptocurrency dropped into the $0.273 support level. This latest price drop is largely driven by the Bitcoin price tumble which saw the cryptocurrency giant breaking back beneath the support at $10,000 as it dropped as low as $9,280 before rebounding.
XRP also fell further lower against Bitcoin. The cryptocurrency had broken above the pivotal 3000 SAT support which led us to believe that XRP could be primed for another price surge higher. This combined with the fact that XRP also finally crossed the $0.30 level made for a scenario in which it was about to explode.
However, when Bitcoin takes a tumble, it is extremely difficult for any altcoin to make significant gains in this type of trading condition. Nevertheless, XRP is still supported at the 200-days EMA and it does look like the selling pressure could be fading.
The cryptocurrency remains ranked in the 3rd position as it holds a total market cap value of $11.94 billion.
How to buy XRP (XRP) on Binance
XRP Price Analysis
What has been going on?
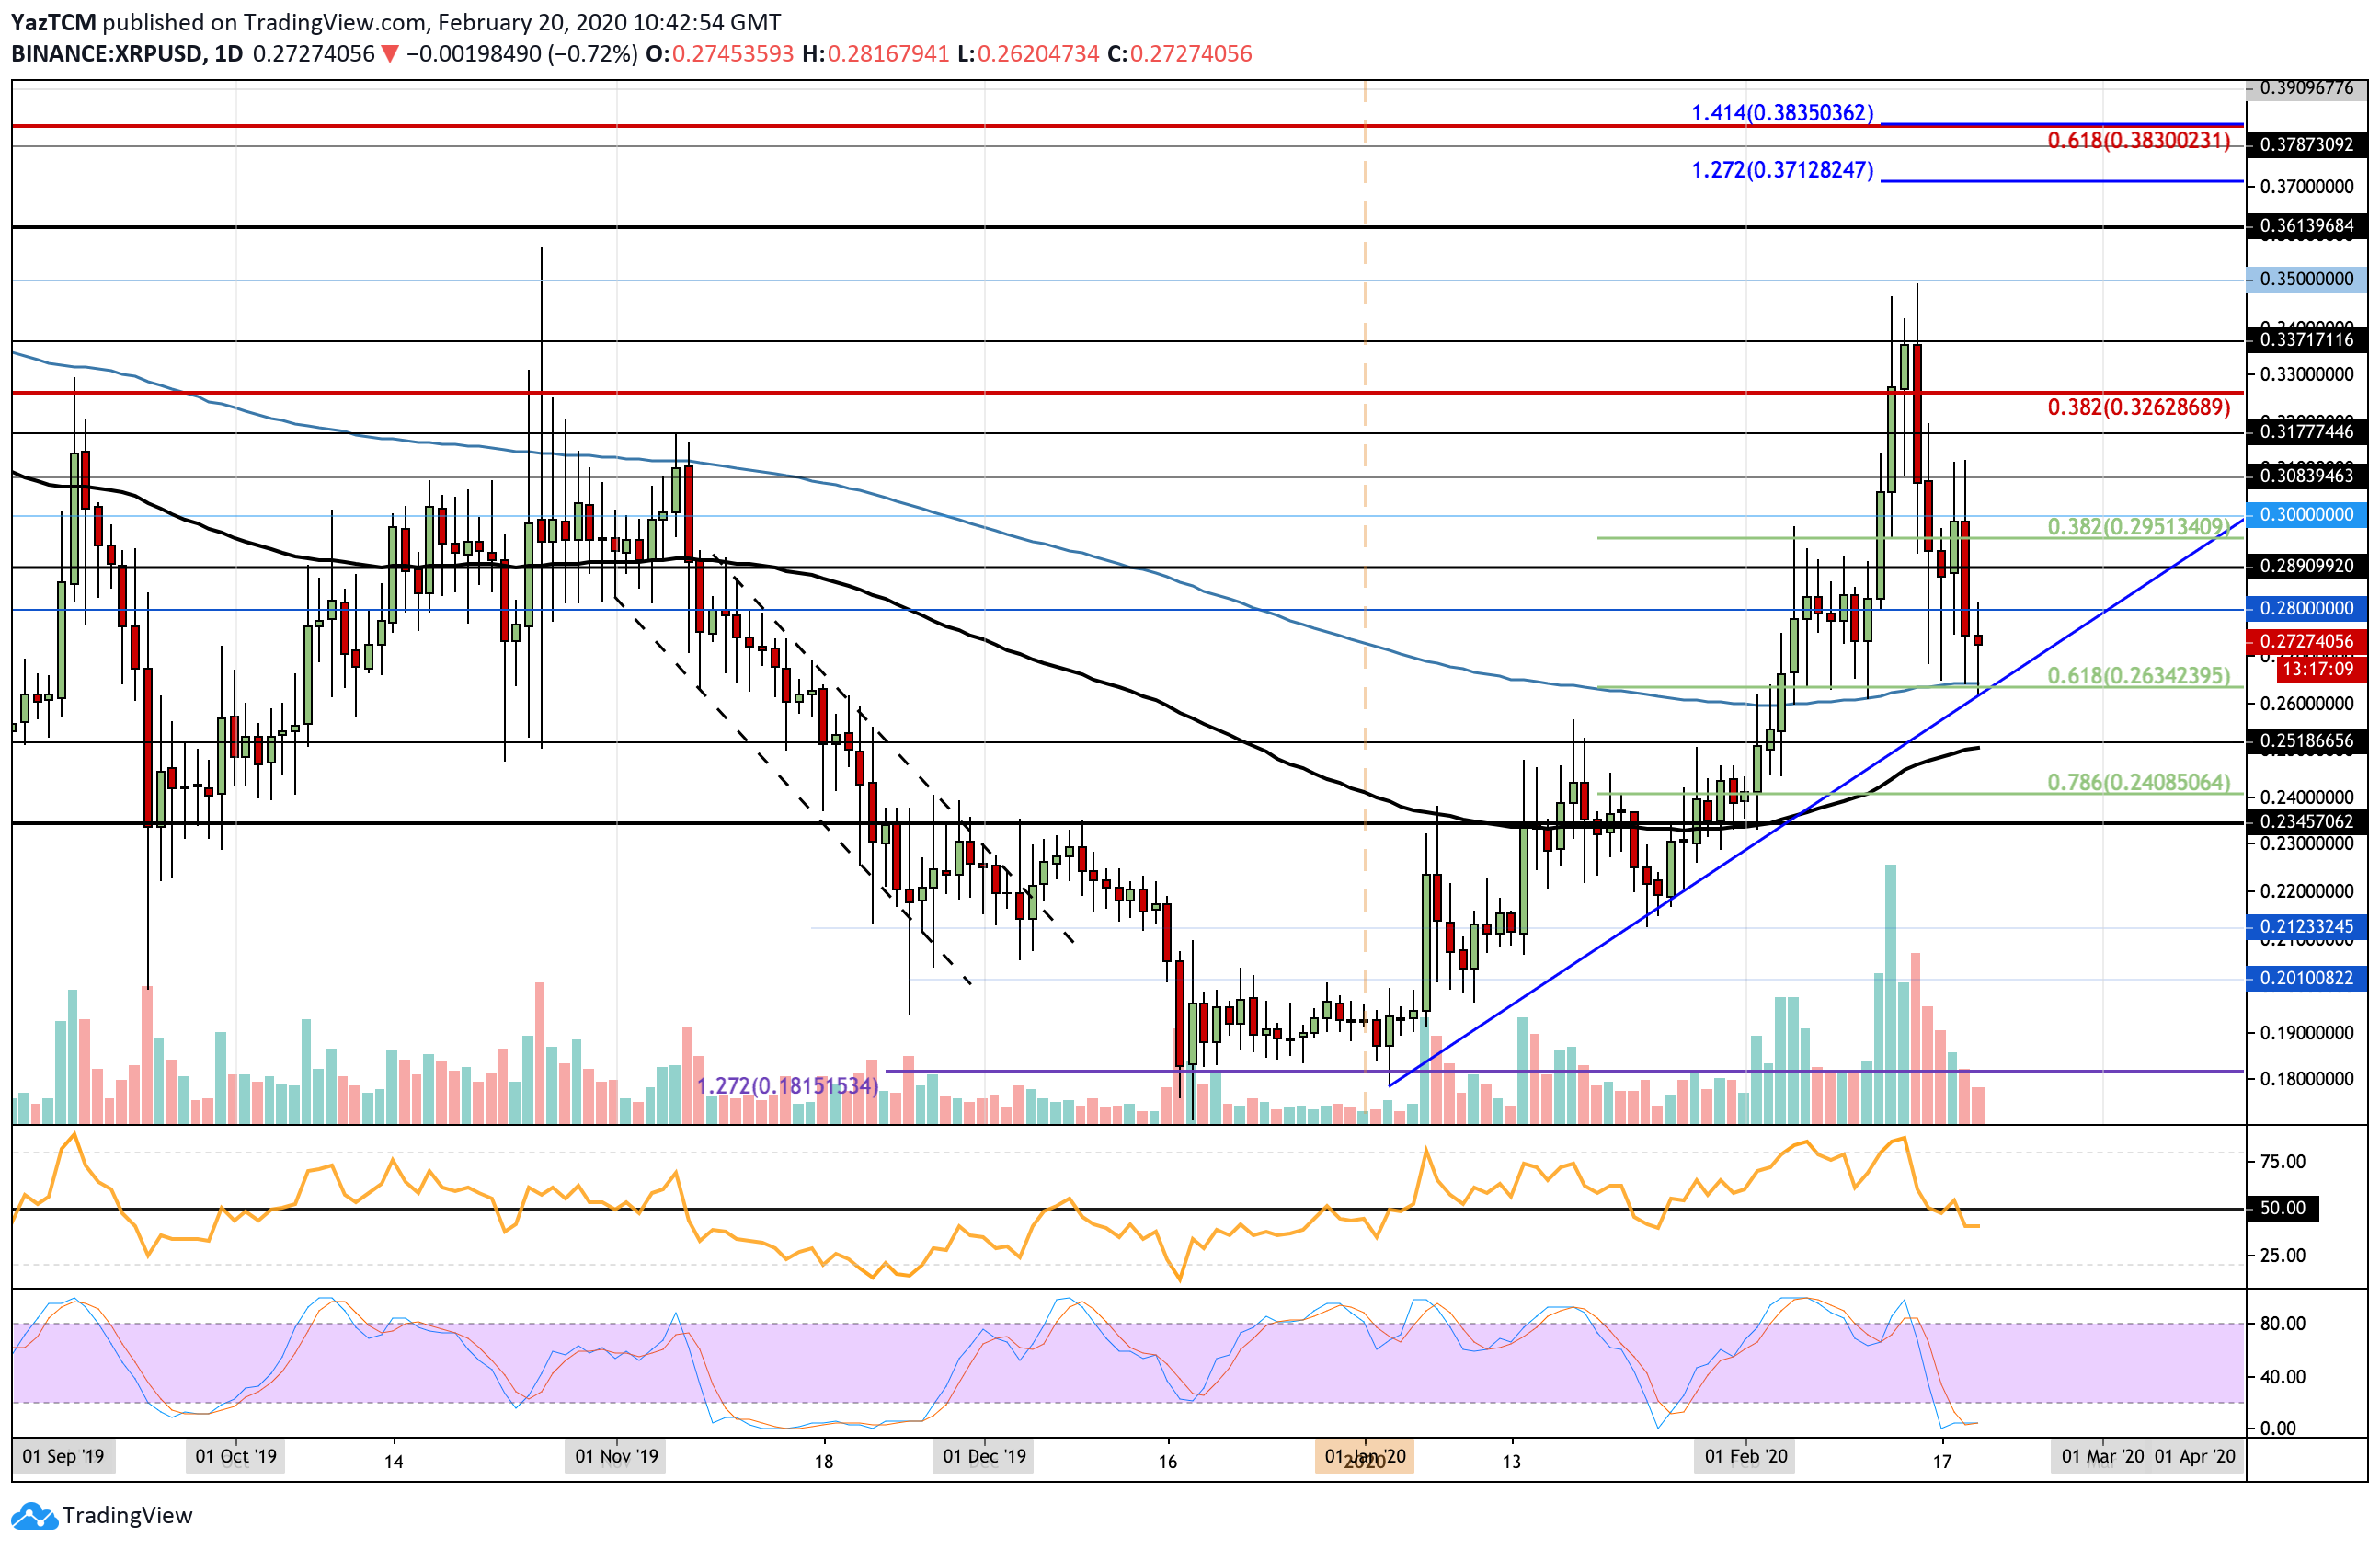
Taking a look at the daily chart above, we can see that XRP was unable to really pass the resistance outlined at $0.337 this week. This caused the cryptocurrency to reverse and begin its price fall.
It dropped quite significantly, falling by a total of 15% over the past 7-days of trading, however, it has managed to remain above the support at the 200-day EMA at around $0.263. This area of support is further bolstered by a short term .618 Fibonacci Retracement level as well as a 2-month-old rising trend line.
XRP price short term prediction: Neutral
The break back beneath the $0.30 has now rendered XRP in a neutral trading condition. However, it is in trouble as it is on the verge of turning bearish if it does collapse beneath the 200-day EMA and the $0.26 level.
If the sellers do push lower, the first level of support is located at $0.263 (aforementioned 200-day EMA combined support). If the sellers continue to break beneath the rising support line, the next level of support lies at $0.26.
Beneath this, additional support lies at $0.251, $0.25 (100-day EMA), and $0.24 (short term .786 Fibonacci Retracement level). This is followed up with further support at $0.2345, $0.23, $0.22, and $0.212.
What if the bulls increase their pressure?
If the bulls manage to defend the support at the 200-day EMA and rebound, the first level of resistance to break toward the upside lies at $0.28. Above this, additional resistance lies at $0.289, $0.295, and $0.30.
If the buyers can bring us back above $0.30, the market will be in the realm of turning bullish again. In this case, we can look for resistance at $0.308, $0.3177, and $0.326 (bearish .382 Fib Retracement).
If they can continue to drive XRP above $0.33, higher resistance lies at $0.337, $0.35, and $0.361.
What are the technical indicators showing?
The indicators are pretty bearish at this moment in time. The RSI recently dropped beneath the 50 level as the sellers start to gain control over the market momentum. However, it is currently trading at the same level it did during mid-January when it found support here and allowed XRP to rebound quite aggressively.
Additionally, the Stochastic RSI is also in extremely oversold conditions, however, it is primed for a bullish crossover signal and when this is delivered, we can expect XRP to surge again.
What has been going on?
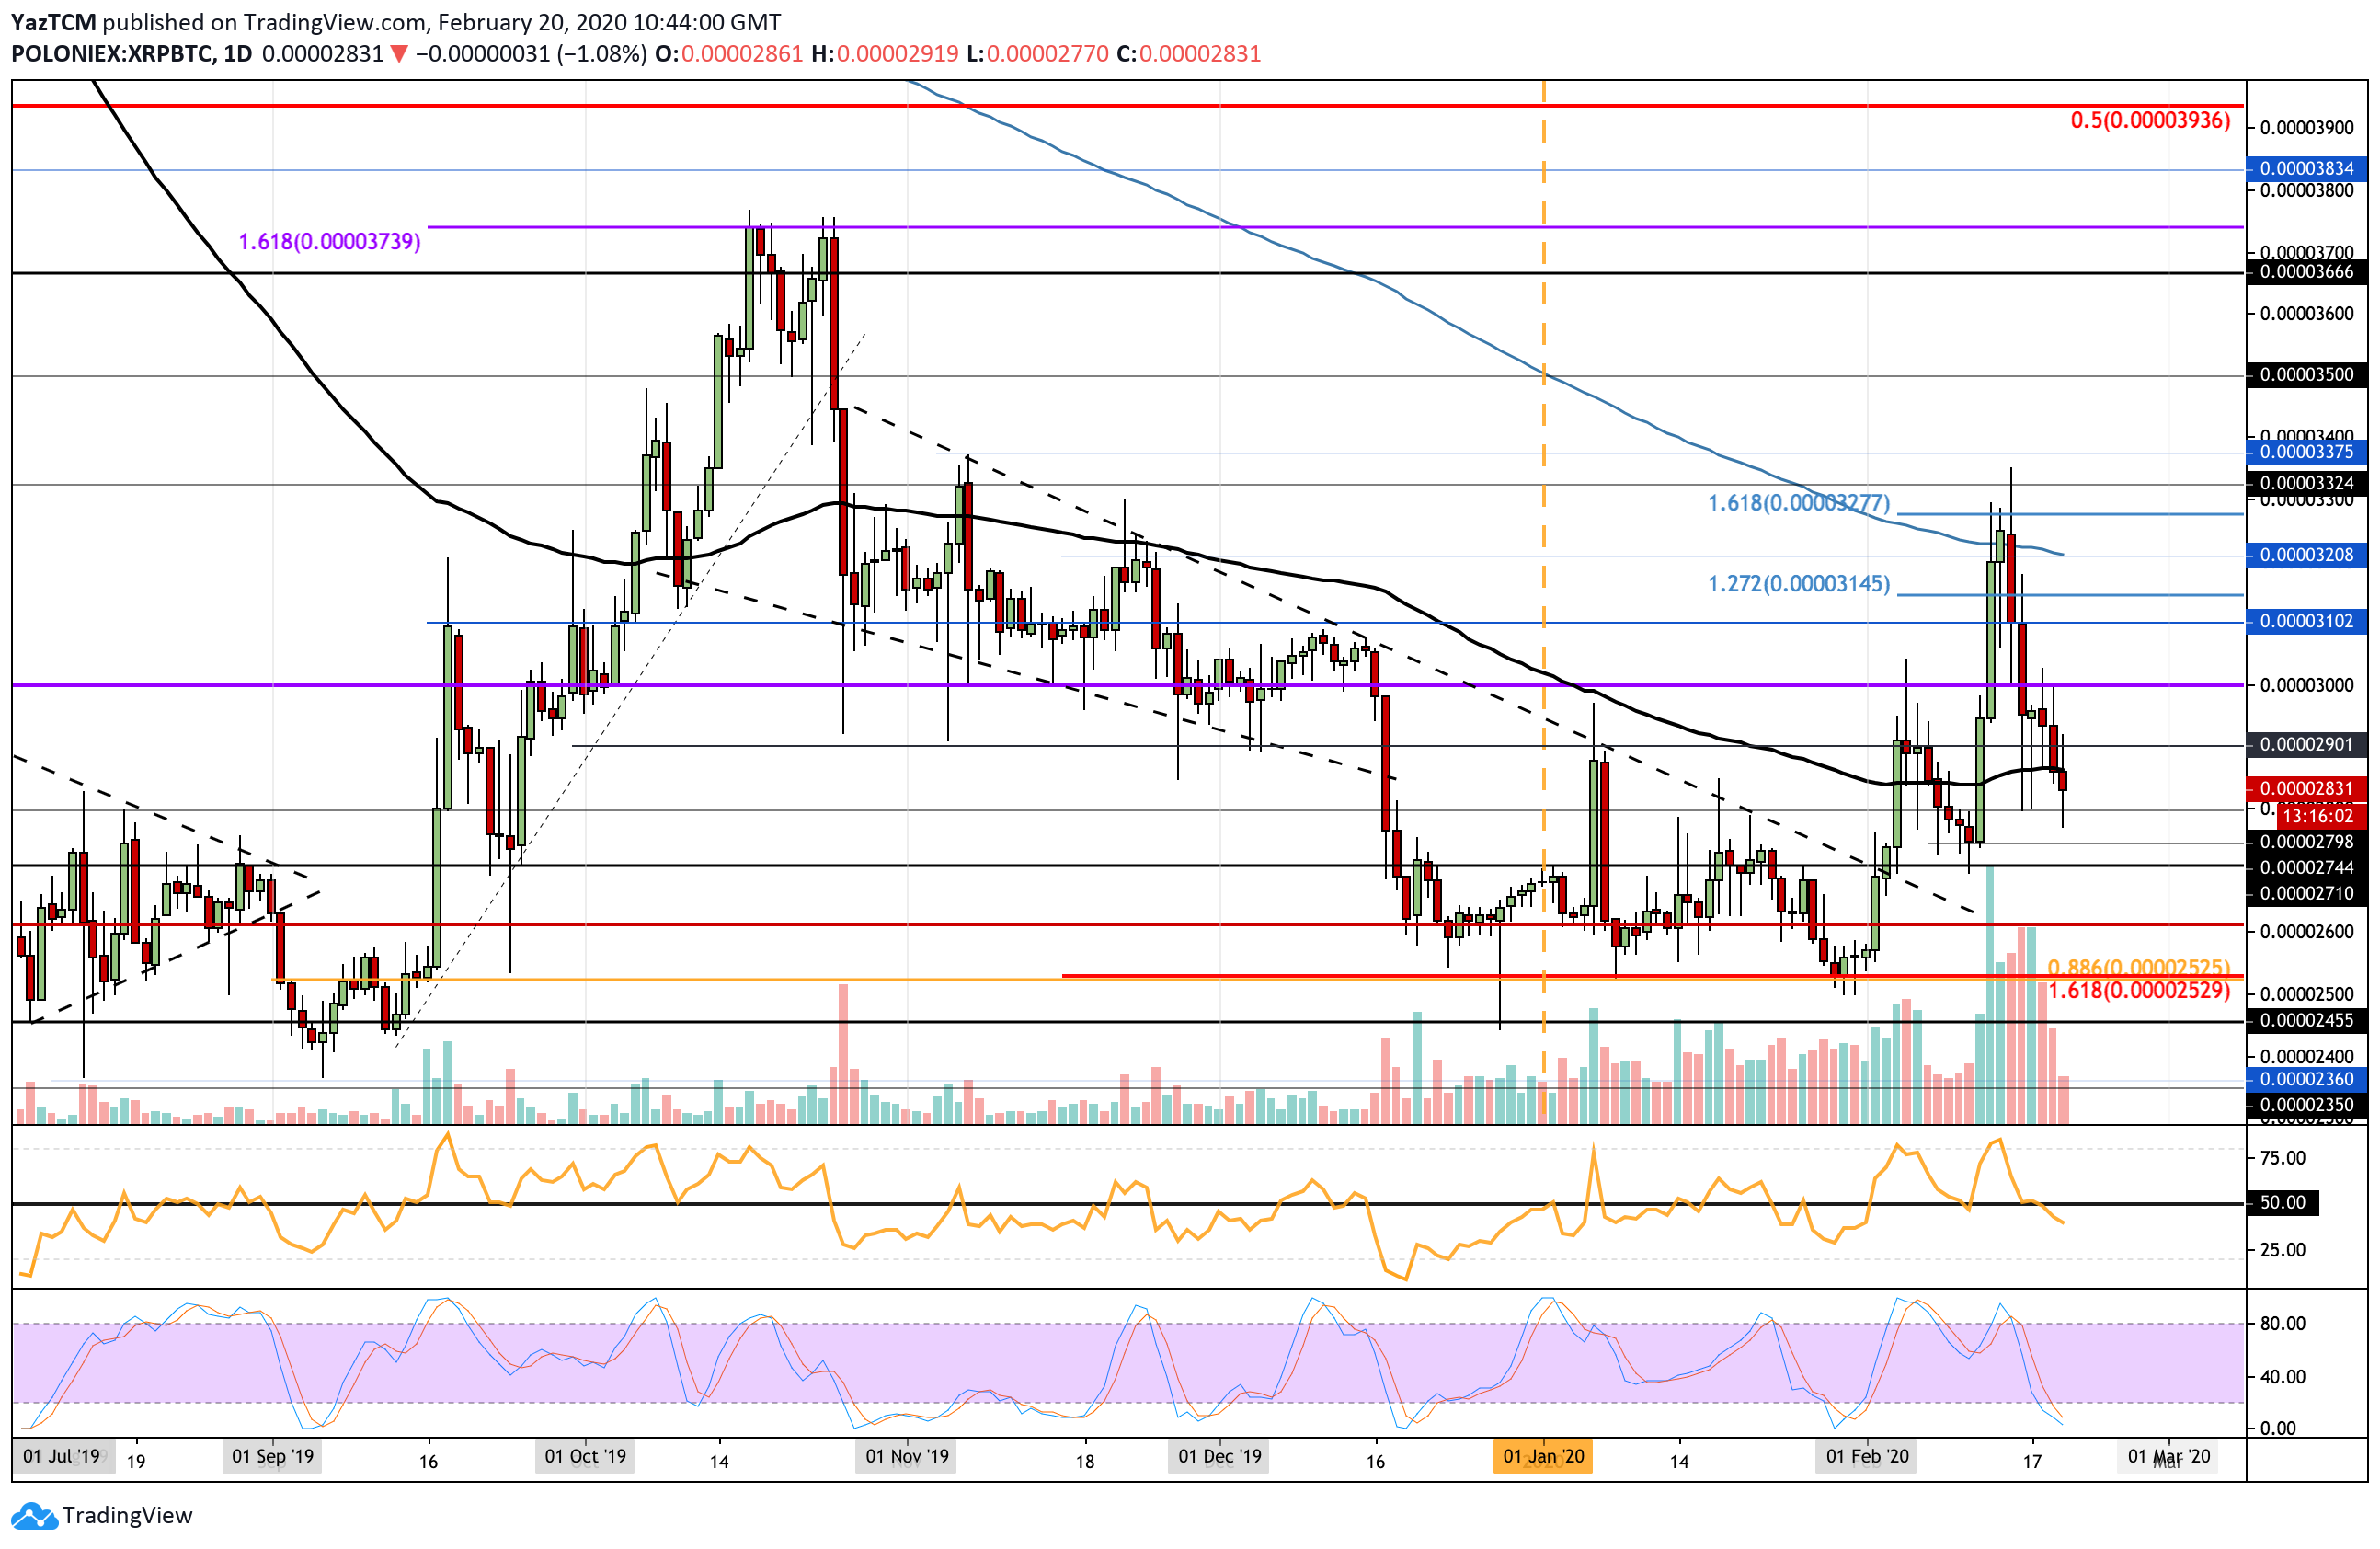
Against Bitcoin, we can see XRP was unable to really overcome resistance at the 200-day EMA at around 3200 SAT. This caused the market to roll over and start to fall. It continued to drop and recently penetrated beneath the 100-day EMA at around 2850 SAT.
XRP price short term prediction: Neutral
The break beneath 2950 SAT puts XRP in danger of turning bearish again. If it continues to fall beneath 2710 SAT the market will resume its previous bearish trend after creating a lower low.
Toward the downside, the first level of strong support lies at 2800 SAT. Beneath this, additional support lies at 2744 SAT, 2710 SAT, 2600 SAT, and 2525 SAT.
What if the bulls increase their pressure?
On the other hand, if the bulls can defend 2800 SAT and bounce back above the 100-days EMA, the first two levels of resistance lie at 2900 SAT and 3000 SAT. Above 3000 SAT, higher resistance is to be expected at 3100 SAT, 3145 SAT, and 3200 SAT.
What are the technical indicators showing?
The RSI has similarly dropped beneath the 50 level to indicate that the sellers are beginning to take charge of the market momentum. We will need to see it break above the 50 level before we can see any form of price recovery within the market.
Additionally, the Stochastic RSI has recently reached oversold conditions, however, it still might need a few more days before it is ready for a bullish crossover signal. This shows that there is still room for some more selling pressure in the interim.
Previous XRP price analysis
At CoinCodex, we regularly publish price analysis articles focused on the top cryptocurrencies. Here's 3 of our most recent articles about the price of XRP:
4y ago
bullish:
0
bearish:
0
Share


 Manage all your crypto, NFT and DeFi from one place
Securely connect the portfolio you’re using to start.

bullish:
1
bearish:
0

bullish:
0
bearish:
0

bullish:
0
bearish:
0
