Bitcoin Cash price sees bulls to $240, settles on $238
4y ago
bullish:
3
bearish:
0
Share

While the altcoin market saw a green light on 6th July, the Bitcoin Cash price rose across the $240 mark. However, the BCH price was unable to sustain above the $240 mark and thus fell below down to the $238 mark. The cryptocurrency traded between the $216 and $241.28 price levels in the past 24-hours.
1-Day Bitcoin Cash price analysis (6th July)
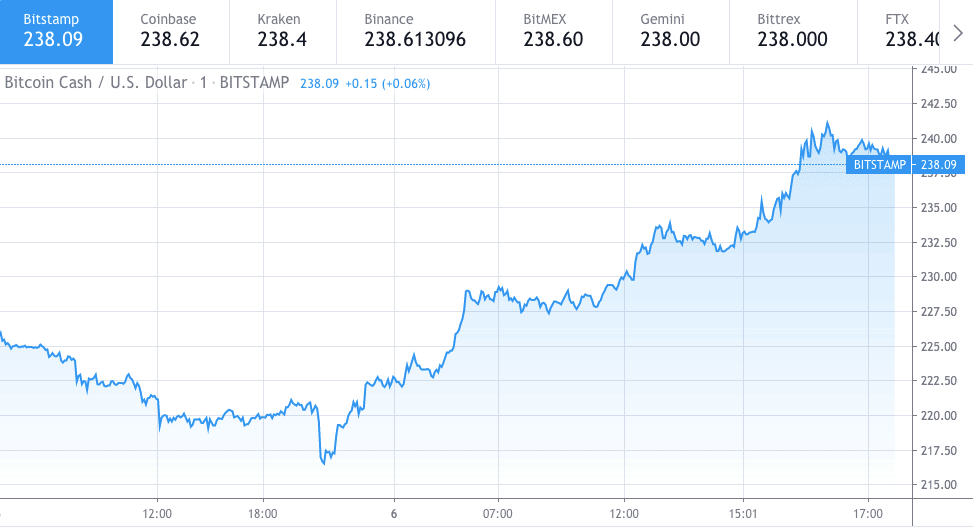
Bitcoin Cash price chart by Trading View
The BCHUSD pair was observed at the $222 mark at the start, while the cryptocurrency saw a gradual increase in its price after the first quarter of 6th July. The BCHUSD pair traded between the $228 and $230 levels until the afternoon when the coin observed another increase in its price. By 15:40 GMT, the cryptocurrency had reached the $236 mark and moved past to the $241.36 mark. At the time of writing, Bitcoin Cash was observed trading at $238.09 US Dollars.
What’s next for Bitcoin Cash’s price?
Guapeva, the TradingView analyst, highlighted a rectangle trading pattern on the 1D BCHUSD trading chart. The analyst believes that the BCHUSD price is finally starting to move upwards, while the BTC pair also shows bulls.
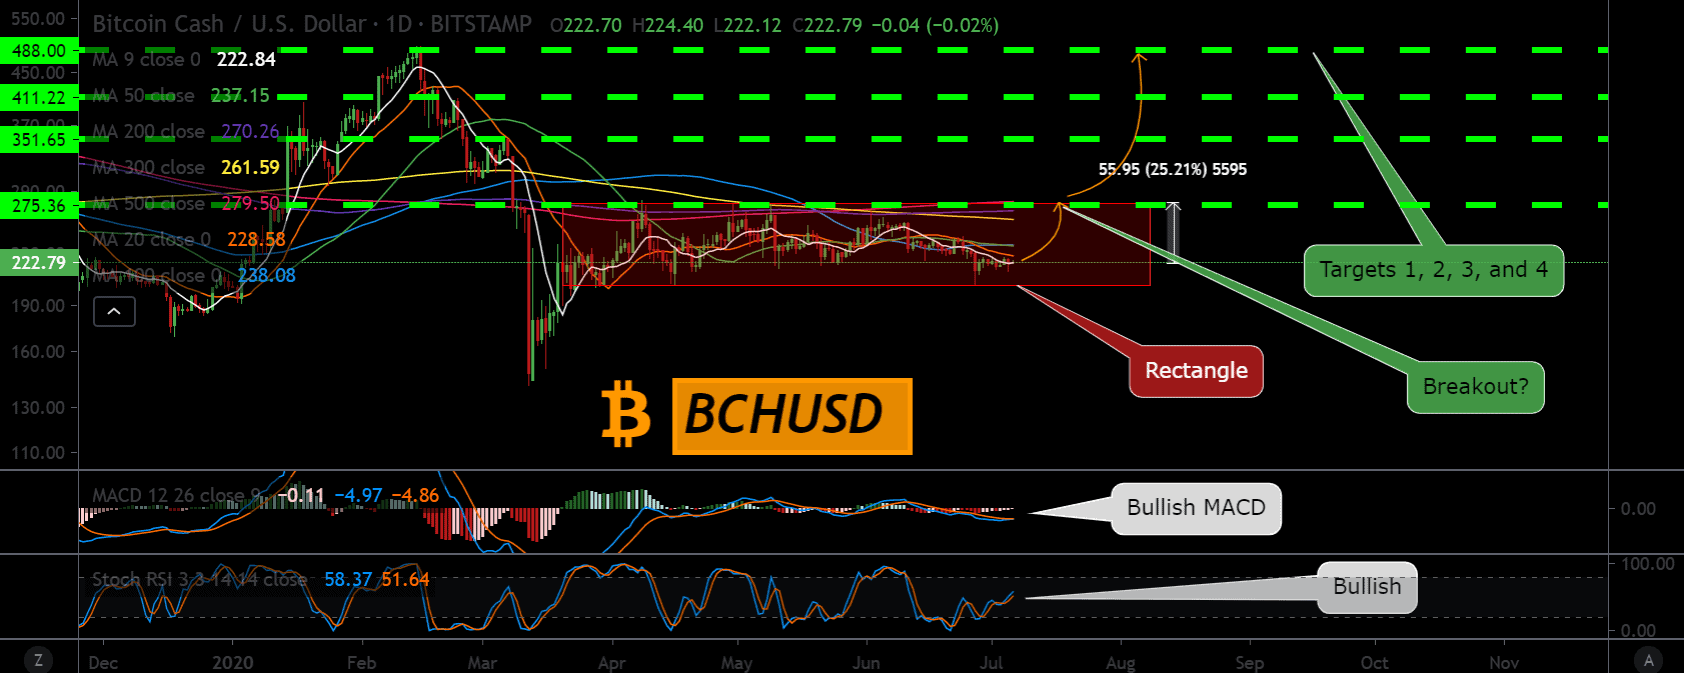
Bitcoin Cash price chart by Trading View
Bitcoin Cash appears to trade towards the bottom of the rectangle pattern shown above, though it is expected to move upwards, after which a bullish rally may be expected from the cryptocurrency.
For this trade, the analyst placed the target price levels at $275.36, $351.65, $411.22, and $488.00. The analyst expects the BCHUSD pair to breakout at the $222.79 mark that lies at the upper boundary of the rectangle trading pattern.
As per the technical analysis of the trading pair, the Stochastic Relative Strength Index (RSI) appears to be bullish, while the Moving Average Convergence Divergence indicator seems bullish as well. The Rectangle trading pattern is a continuation pattern; hence BCHUSD is currently in a bullish stage.
Disclaimer: The information provided is not trading advice but an informative analysis of the price movement. Cryptopolitan.com holds no liability towards any investments based on the information provided on this page.
4y ago
bullish:
3
bearish:
0
Share


 Manage all your crypto, NFT and DeFi from one place
Securely connect the portfolio you’re using to start.

bullish:
0
bearish:
0

bullish:
0
bearish:
0

