Bitcoin: How likely is a March-style 40% crash?
3y ago
bullish:
49
bearish:
27
Share

Bitcoin's price is range-bound in the short to medium term for sure, but in the long-term, the price has been showing no bullish signs. Hence, an obvious place to turn to is the past. Although the past tells a brief and unclear story, it is a story that cannot be ignored.
The history of Bitcoin shows that there are crashes that span anywhere between a simple 10%-20% drop to ones that range up t0 40%-70%. It isn't surprising, especially considering the fact that Bitcoin drawdowns are in the range of 80% and 90% after a bull run.
Bitcoin price crash: Is a 40% drop viable?
A price retracement of 40% seems impossible simply due to the fact that there are a lot of institutions that have bought Bitcoin above $20,000 and more at $30,000. Hence, if there are any small drops, they are being bought up by institutions quickly and effectively, with Grayscale being one of the major competitors.
In 26 days of January 2021, Grayscale has acquired a whopping 40,000 BTC, showing no signs of stopping. MicroStrategy is also doing something similar. With so much bullishness in the ecosystem, it doesn't feel like Bitcoin will experience anything remotely close to a 40% drop, right?
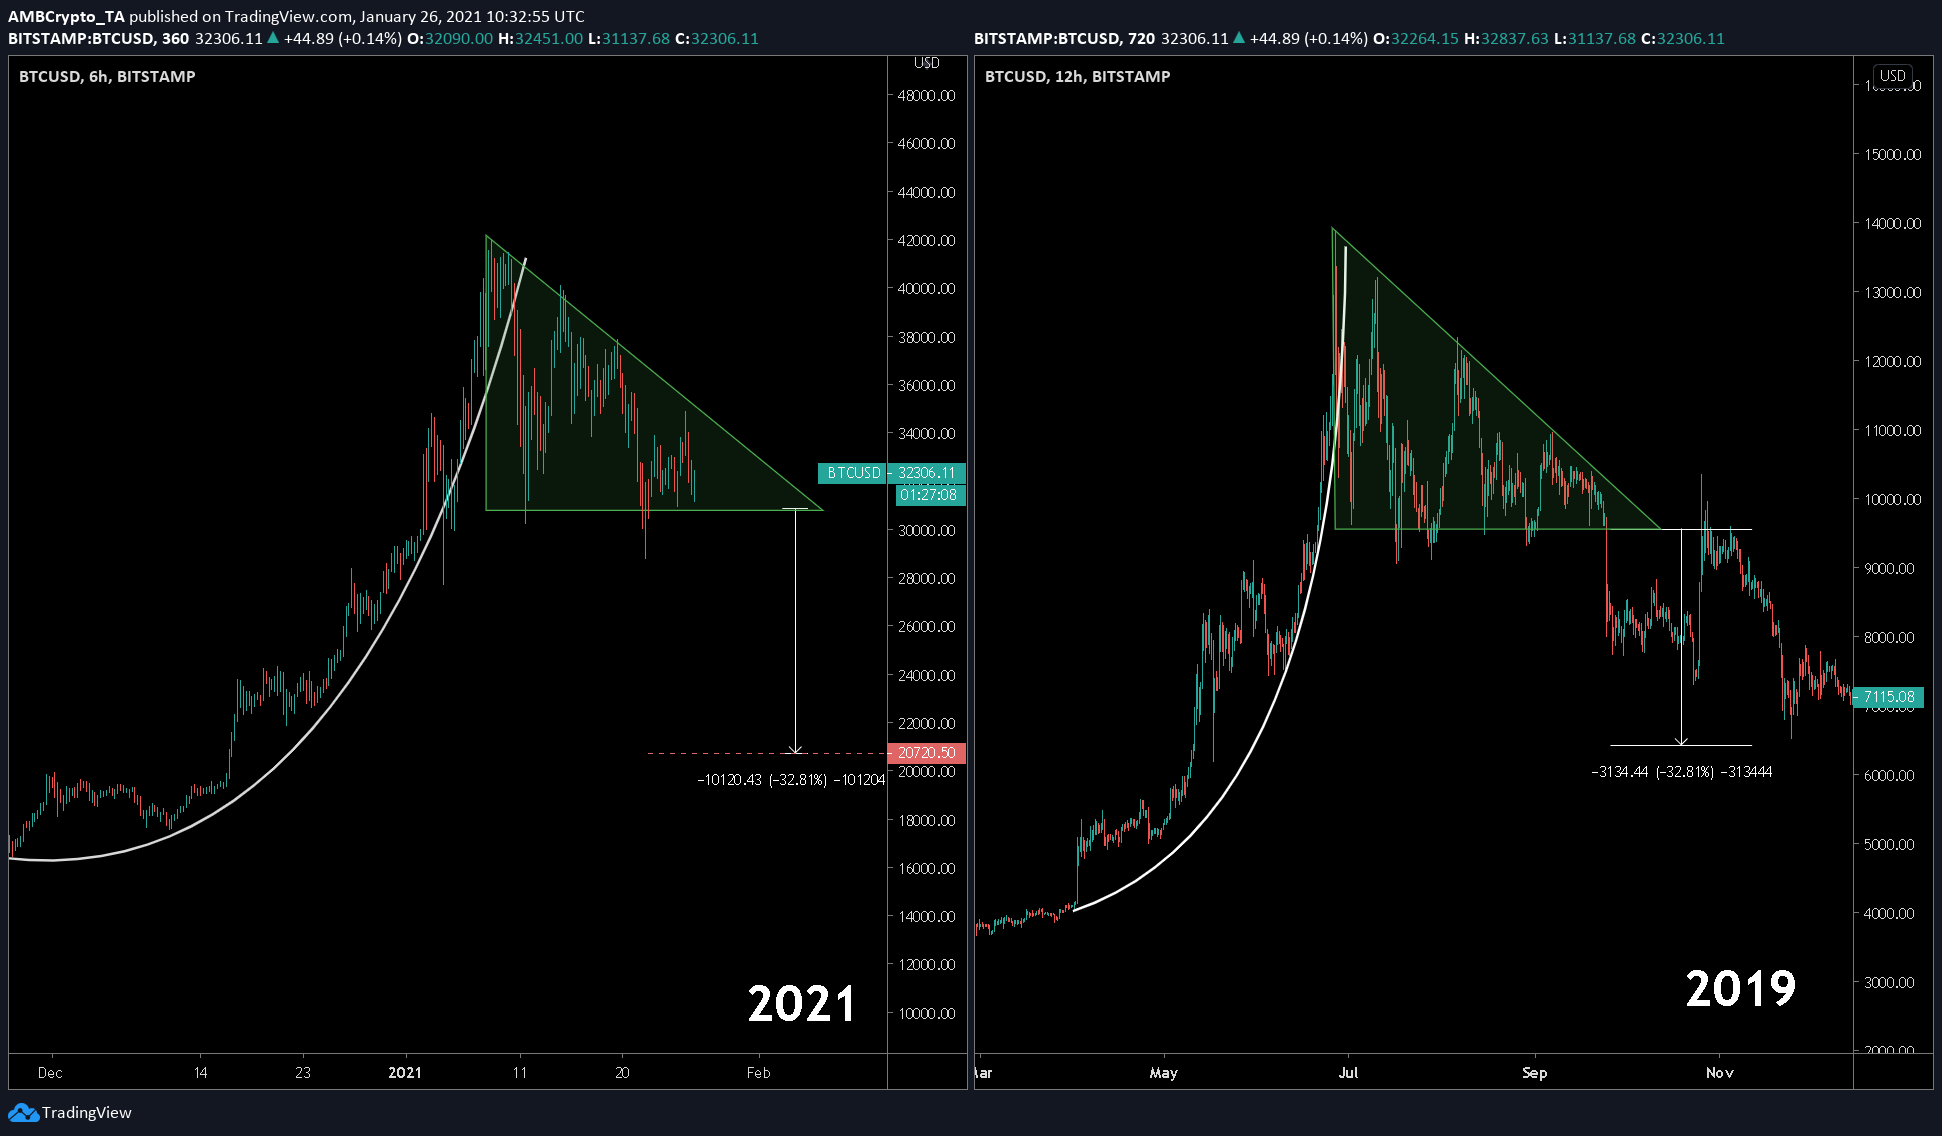
Consider this Bitcoin fractal as an example
Source: BTCUSD on TradingView
The attached fractal highlights similarities between the 2019 cycle and the current cycle. Both the times, the price hit a local top and consolidated into a bearish descending triangle pattern, one which eventually led to a drop of 30%. Additionally, both the patterns were preceded by a parabolic explosion in price.
This time around, if the same breakout occurs, BTC's price can hit its previous ATH at $20,000, a development that would be the perfect opportunity to retest a crucial level and begin a new cycle.
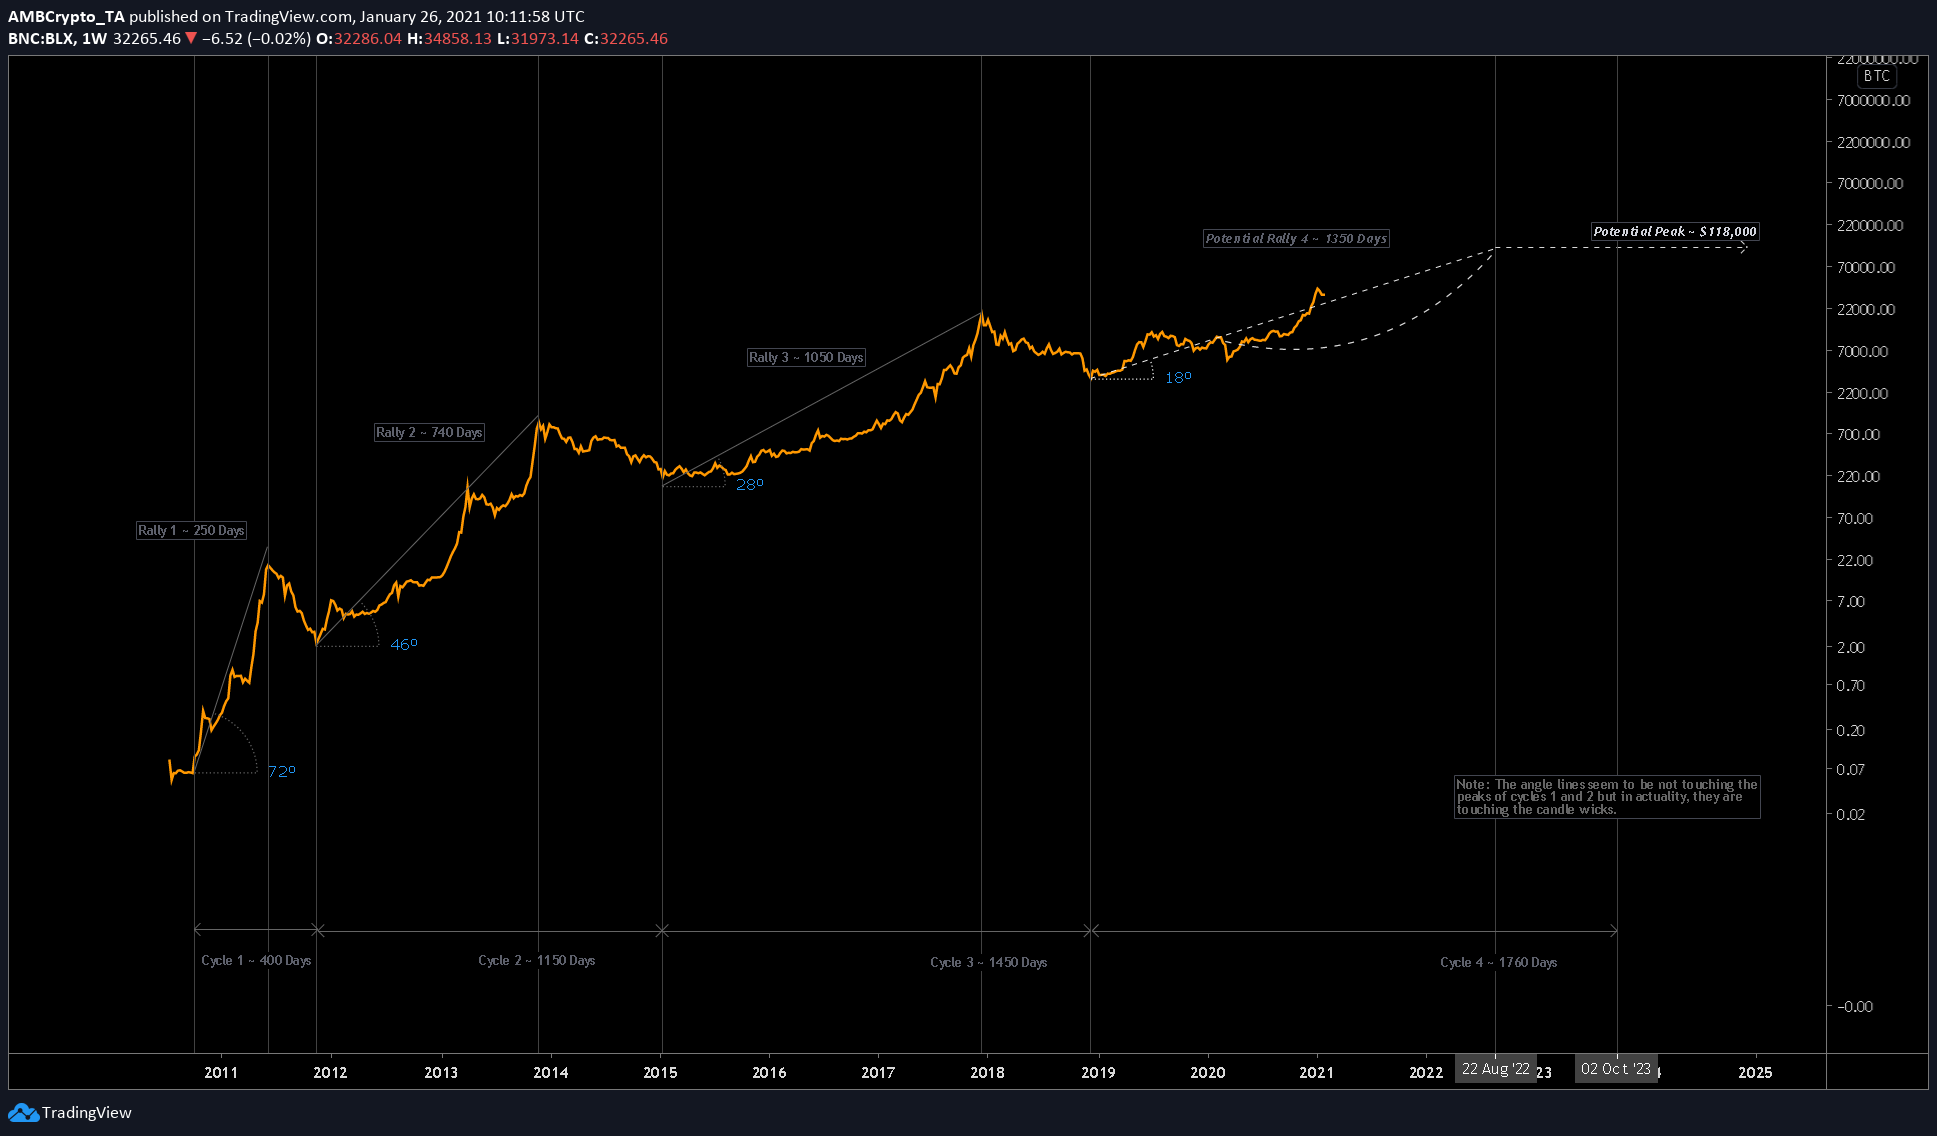
Supporting this theory is the RoI cycle chart, with the same showing that the price was trading above the angle line which connects the bottom of the previous cycle to the top of the preceding cycle. In each cycle, a price movement above this line has always been followed by a dip below the same line.
Source: BLX on TradingView
Going by that logic, a Bitcoin price dip of this magnitude would indeed push the price back below the said line, fulfilling the prophecy. All-in-all, a drop to $20,000 doesn't seem far-fetched if a drop to $25,000 can be expected. Hence, ruling out this uber-bearish scenario would be ignorance.
The post Bitcoin: How likely is a March-style 40% crash? appeared first on AMBCrypto.
3y ago
bullish:
49
bearish:
27
Share

 Manage all your crypto, NFT and DeFi from one place
Securely connect the portfolio you’re using to start.

bullish:
0
bearish:
0

bullish:
0
bearish:
0

bullish:
0
bearish:
0

bullish:
0
bearish:
0