Bitcoin SV, Litecoin, Polkadot Price Analysis: 02 May
3y ago
bullish:
2
bearish:
0
Share

Even though Bitcoin traded below $57,000 at the time of writing, a comeback above $60K was expected in the coming days. Meanwhile, alts such as Bitcoin SV, Litecoin and Polkadot remained below major resistance points and awaited bullish cues from the broader market to surge on their respective charts.
Bitcoin SV [BSV]
Source: BSV/USD, TradingView
Bitcoin SV's price was at a crucial juncture on the 4-hour timeframe. The price snapped higher lows on its ascent towards $341 and it seemed like it was only a matter of time till this upper ceiling was breached. A successful breakout above $341 would see gains all the way up to $390 in the BSV market, but the bulls needed to gather strength before such a move.
Awesome Oscillator noted rising bearish momentum, while MACD closed in on a bearish crossover. A fall below the lower trendline would negate the pattern and $275-support would be in focus in such a scenario.
Litecoin [LTC]
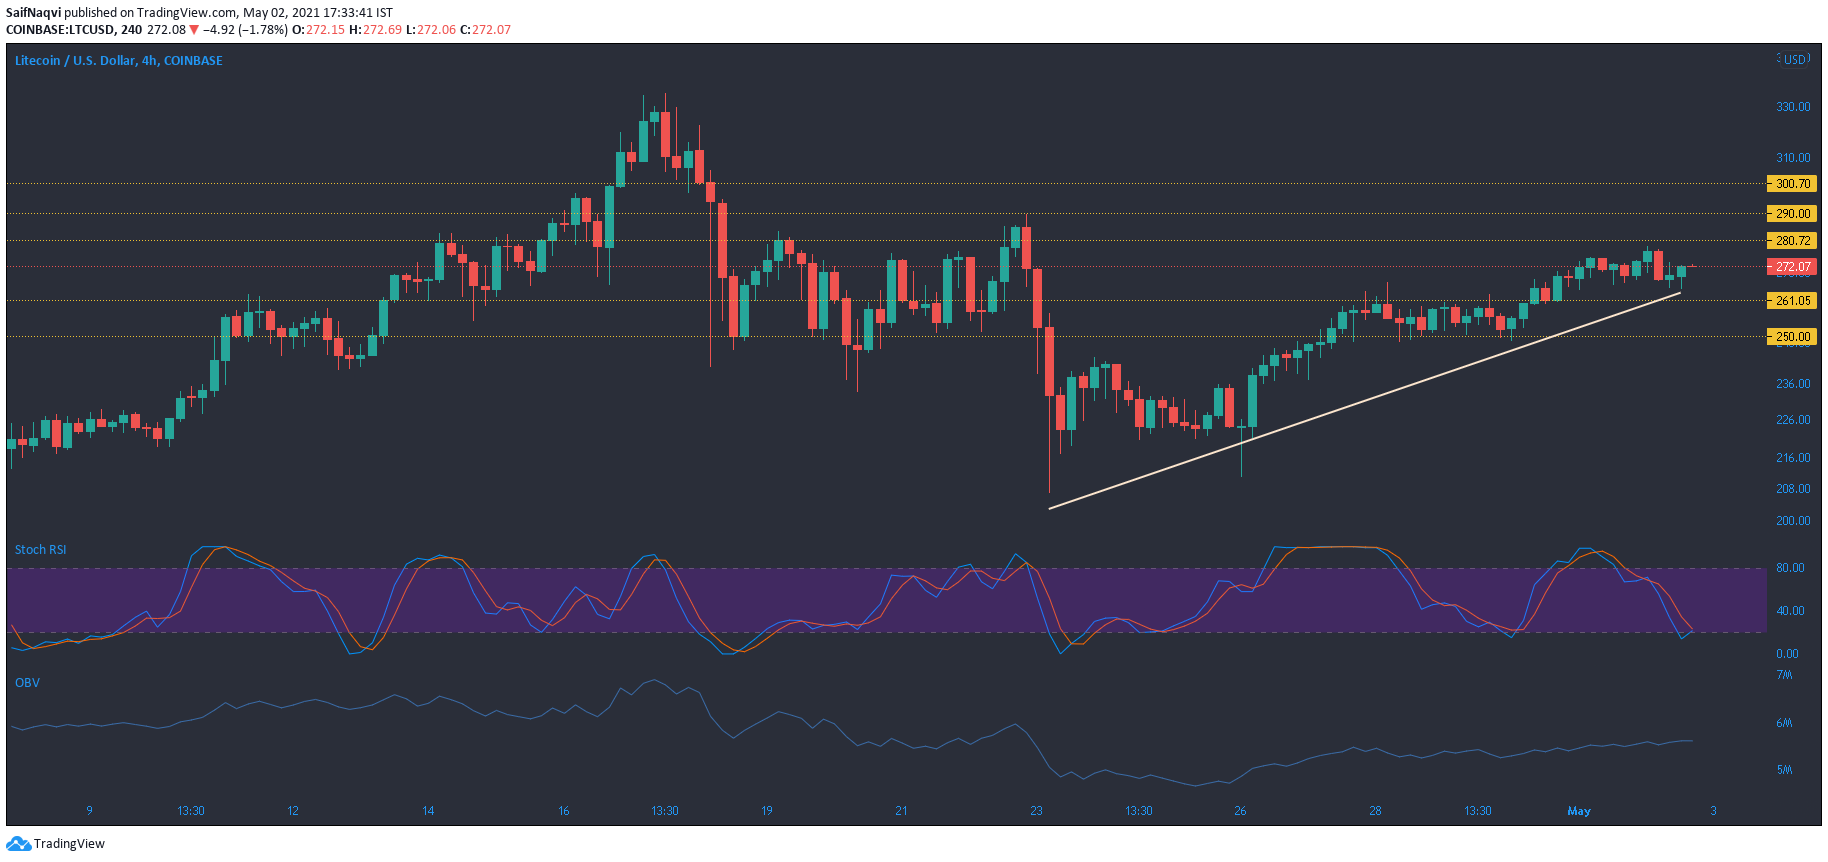
Source: LTC/USD, TradingView
Much like BSV, Litecoin was also in a similar predicament on its 4-hour chart. The bulls needed to regain the region above $290 for a northbound surge but $261-support first needed to be defended from some bearish pressure. Stochastic RSI dropped towards the oversold zone but a bullish crossover was be expected over the coming sessions.
On the plus side, OBV rose steadily after lows seen during the last week of April. This steady buying pressure was a positive sign for LTC's short-mid term trajectory. Recapturing the area above $300 would likely see LTC head towards $350.
Polkadot [DOT]
Source: DOT/USD, TradingView
A recovery was underway in the Polkadot market after the price dropped as low as $26 during end-April. At the time of writing, the recovery was kept at bay at the 50% Fibonacci retracement level ($37.4). According to OBV's flat-like movement, buying pressure equaled selling pressure over the past few sessions as the bears maintained DOT below its overhead resistance level.
However, ADX Indicator clocked in at 20 as bullish strength was on the buildup. Dips are not expected in such a situation and instead, resistance levels would be under the spotlight. One such level resided at the 61.8% Fibonacci level close to $40. Successfully retaking this area could see DOT rise towards its next target at $44.
The post Bitcoin SV, Litecoin, Polkadot Price Analysis: 02 May appeared first on AMBCrypto.
3y ago
bullish:
2
bearish:
0
Share


 Manage all your crypto, NFT and DeFi from one place
Securely connect the portfolio you’re using to start.

bullish:
0
bearish:
0

bullish:
0
bearish:
0

bullish:
0
bearish:
0
