Bitcoin price breaks major resistance to touch $9,972 amid halving euphoria
4y ago
bullish:
5
bearish:
0
Share
- Bitcoin price posts a healthy 10 percent gain over the past 24 hours to touch $9,972.
- Next major resistance stands at $10,500 and $10,900.
- Daily trading volume rises but BTC halving and institutional investors would decide the next move.
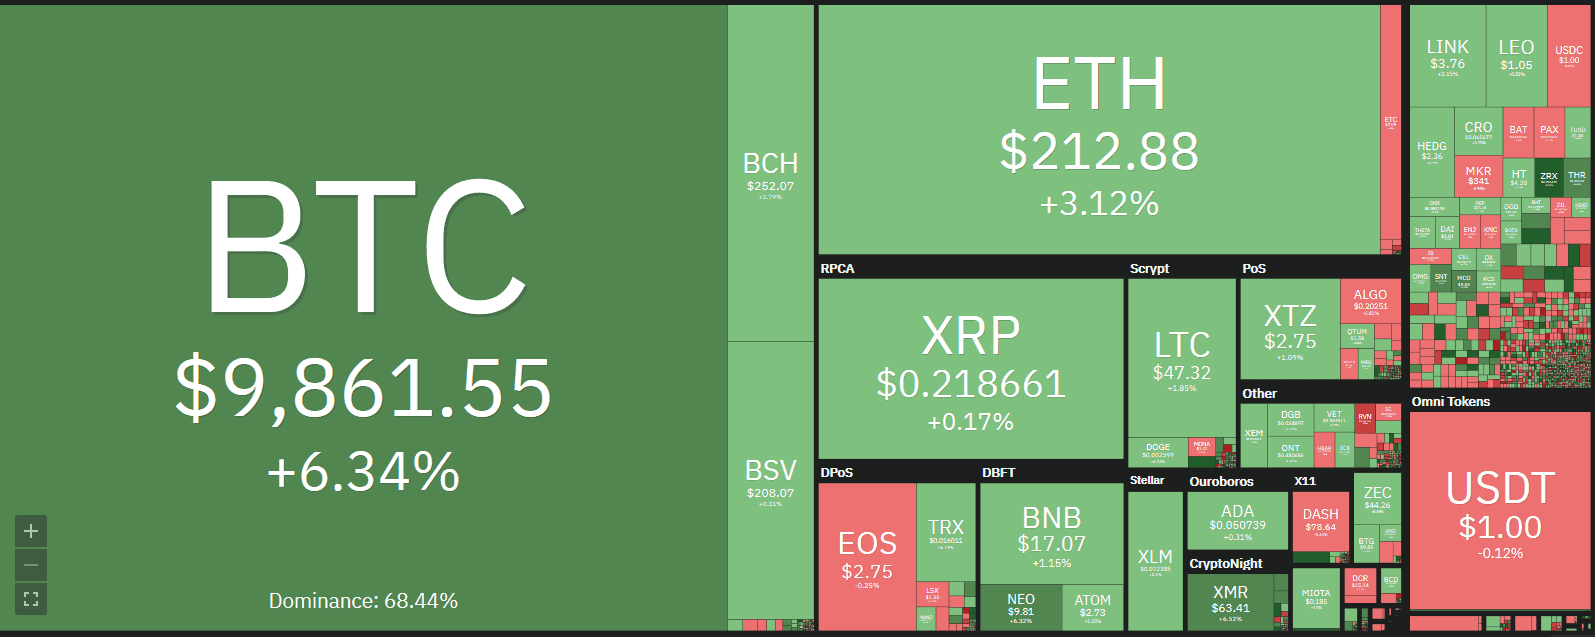
Cryptocurrency Heat Map by Coin360
Bitcoin has broken a crucial resistance level and moved above the triangular pattern that engulfed the price for the past two days. After breaking the crucial resistance at $9,400, the BTC/USD price touched a daily high of $9,972. This marks the end of the consolidation that kept Bitcoin’s price range-bound.
Euphoric buyers push up the Bitcoin price
As Bitcoin’s third halving approaches near, the price is breaking all the resistance barriers and even defy the traditional markets. Bitcoin halving is creating a ‘Fear-of-Missing-Out’ scenario, and buyers are emerging from everywhere. Many analysts believe that the upcoming BTC halving will bring another bull market at the Bitcoin price because block halving will boost the cryptocurrency’s rarity credentials.
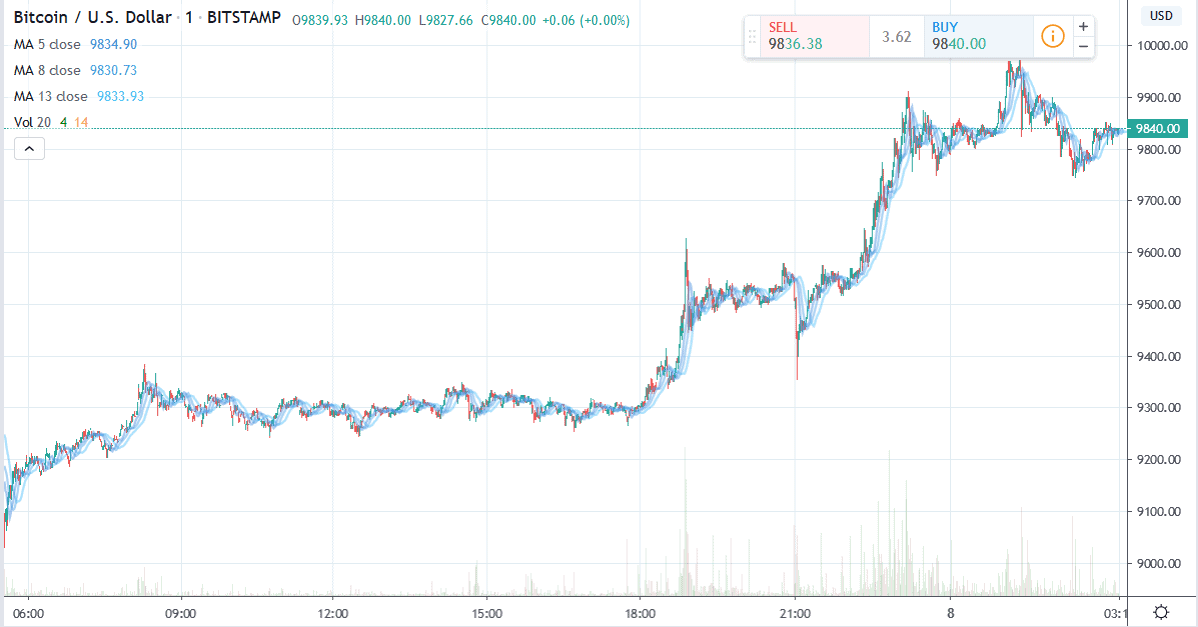
Bitcoin Price Chart by TradingView
Taking into consideration the $20,000 high of 2017, the long-term resistance in daily charts stood at $9,550. And today, the Bitcoin price has confidently broken above this resistance. The BTC/USD pair is now flirting with the psychologically important level of $10,000.
If today’s price closes above $9,550 mark, it would be a clear signal that Bitcoin price is about to take off to new highs. Also, it would mark the end of the dystopian bear market that saw prices touch $3,850. The Fibonacci retracement level of 127.2% stands at $10,500 and would likely prove to be strong resistance.
Technical indicators overstretched on daily charts
Yesterday’s daily candle closed with a bearish signal, but today’s explosive up move signals a clear reversal of bearish pressure. Daily volumes post BTC halving will decide if the price corrects to $8,830 level or not. Daily RSI is stretching above 80, and MACD is also rising.
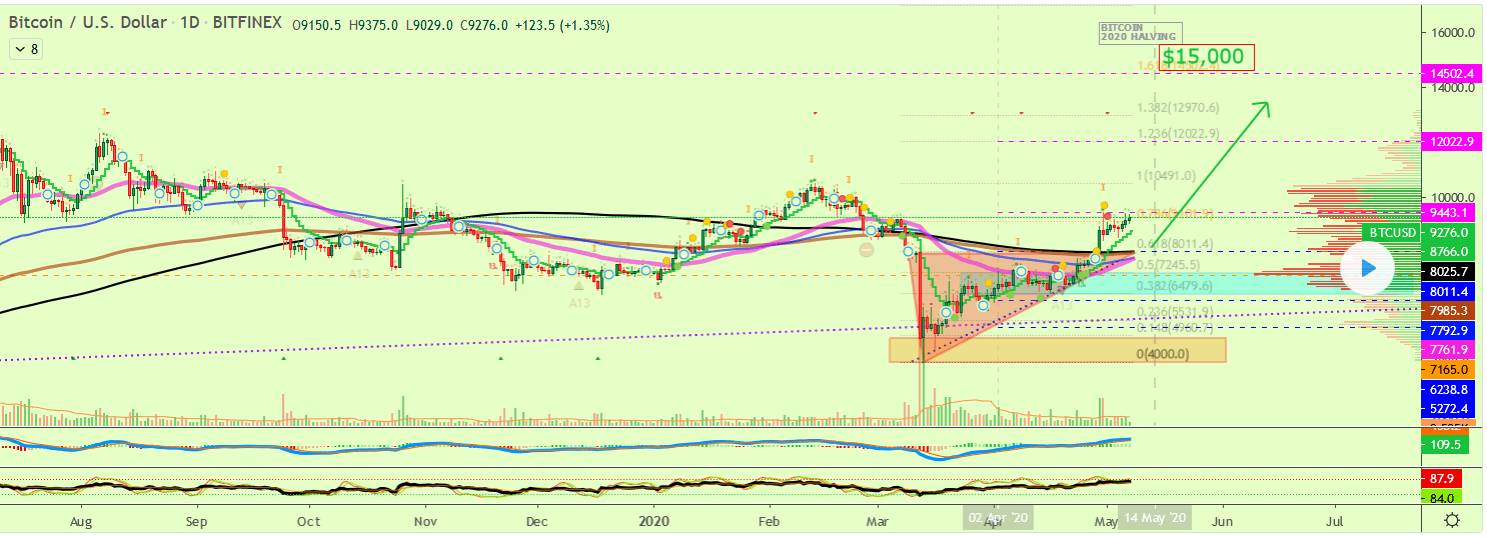
Bitcoin Price Chart by TradingView
Crypto analyst Alan Masters points out in above chart that Bitcoin can even touch $15000 before halving. Today’s uptrend can be attributed to the Bitcoin halving euphoria. Sentiment buying has pushed the daily trading volume to touch the 22,000. However, the very factor that is triggering buying can also result in abrupt selling when the halving event is absorbed.
Will whales dump Bitcoin post the halving
Large BTC holders would decide the next course of action once the halving passes. If buyers are able to sustain the upside momentum with good trading volumes, the bullish trend can see the Bitcoin price touch $13,000 in the next few days. Also, large leveraged positions above $9,000 would liquidate, and book profits near or post halving with can prove painful for Bitcoin price.
Disclaimer: The information provided is not trading advice but informative analysis of the price movement. Cryptopolitan.com holds no liability towards any investments based on the information provided on this page.
4y ago
bullish:
5
bearish:
0
Share


 Manage all your crypto, NFT and DeFi from one place
Securely connect the portfolio you’re using to start.

bullish:
0
bearish:
0

bullish:
0
bearish:
0


bullish:
0
bearish:
0