Stellar Lumens, NEM, Zcash Price Analysis: 15 January
3y ago
bullish:
2
bearish:
1
Share

Stellar Lumens marked some important levels on the price charts over the last few days and it could be set to trade within a range for the next few days as well. NEM was in a similar situation, and its rejection at a level of resistance could see a drop to $0.2. Finally, Zcash could revisit $100 as support, should the bulls be unable to defend the $110-region.
Stellar Lumens [XLM]
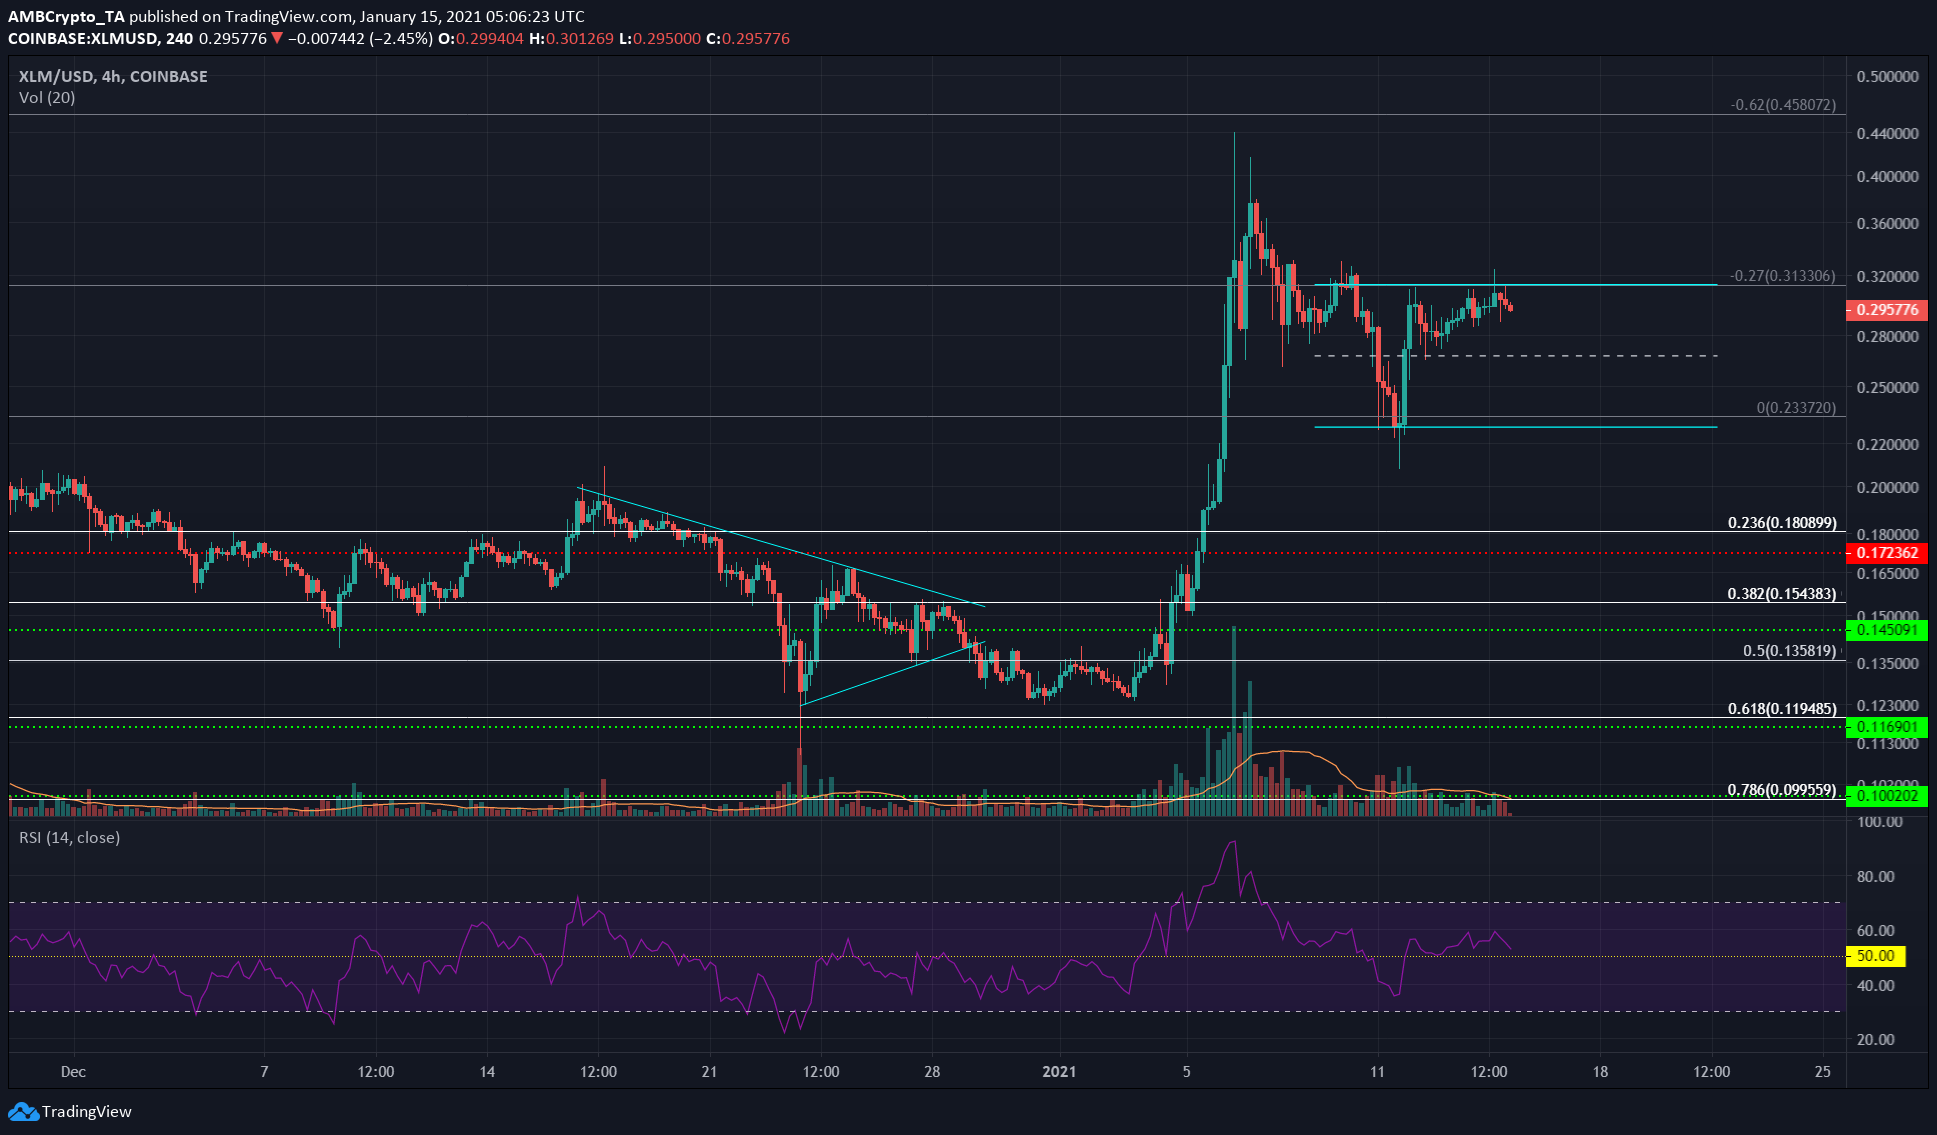
Source: XLM/USD on TradingView
Stellar Lumens surged recently from $0.23 to $0.31 on the price chart. This represented a possible range that XLM could trade within for several more days to come, with its boundaries at $0.224 and $0.313 and the mid-point at $0.265.
These two levels have been of importance since the November surge from $0.079 to $0.233. This move's 27% extension was $0.313.
At the time of writing, XLM was trading above the mid-point and the RSI climbed above neutral 50 to indicate a shift in momentum towards the bullish side.
XLM's price has been unable to close above the range, however, it should be noted that trading volume has also been low. A trading session close above the range on significant trading volume would confirm a breakout.
NEM [XEM]
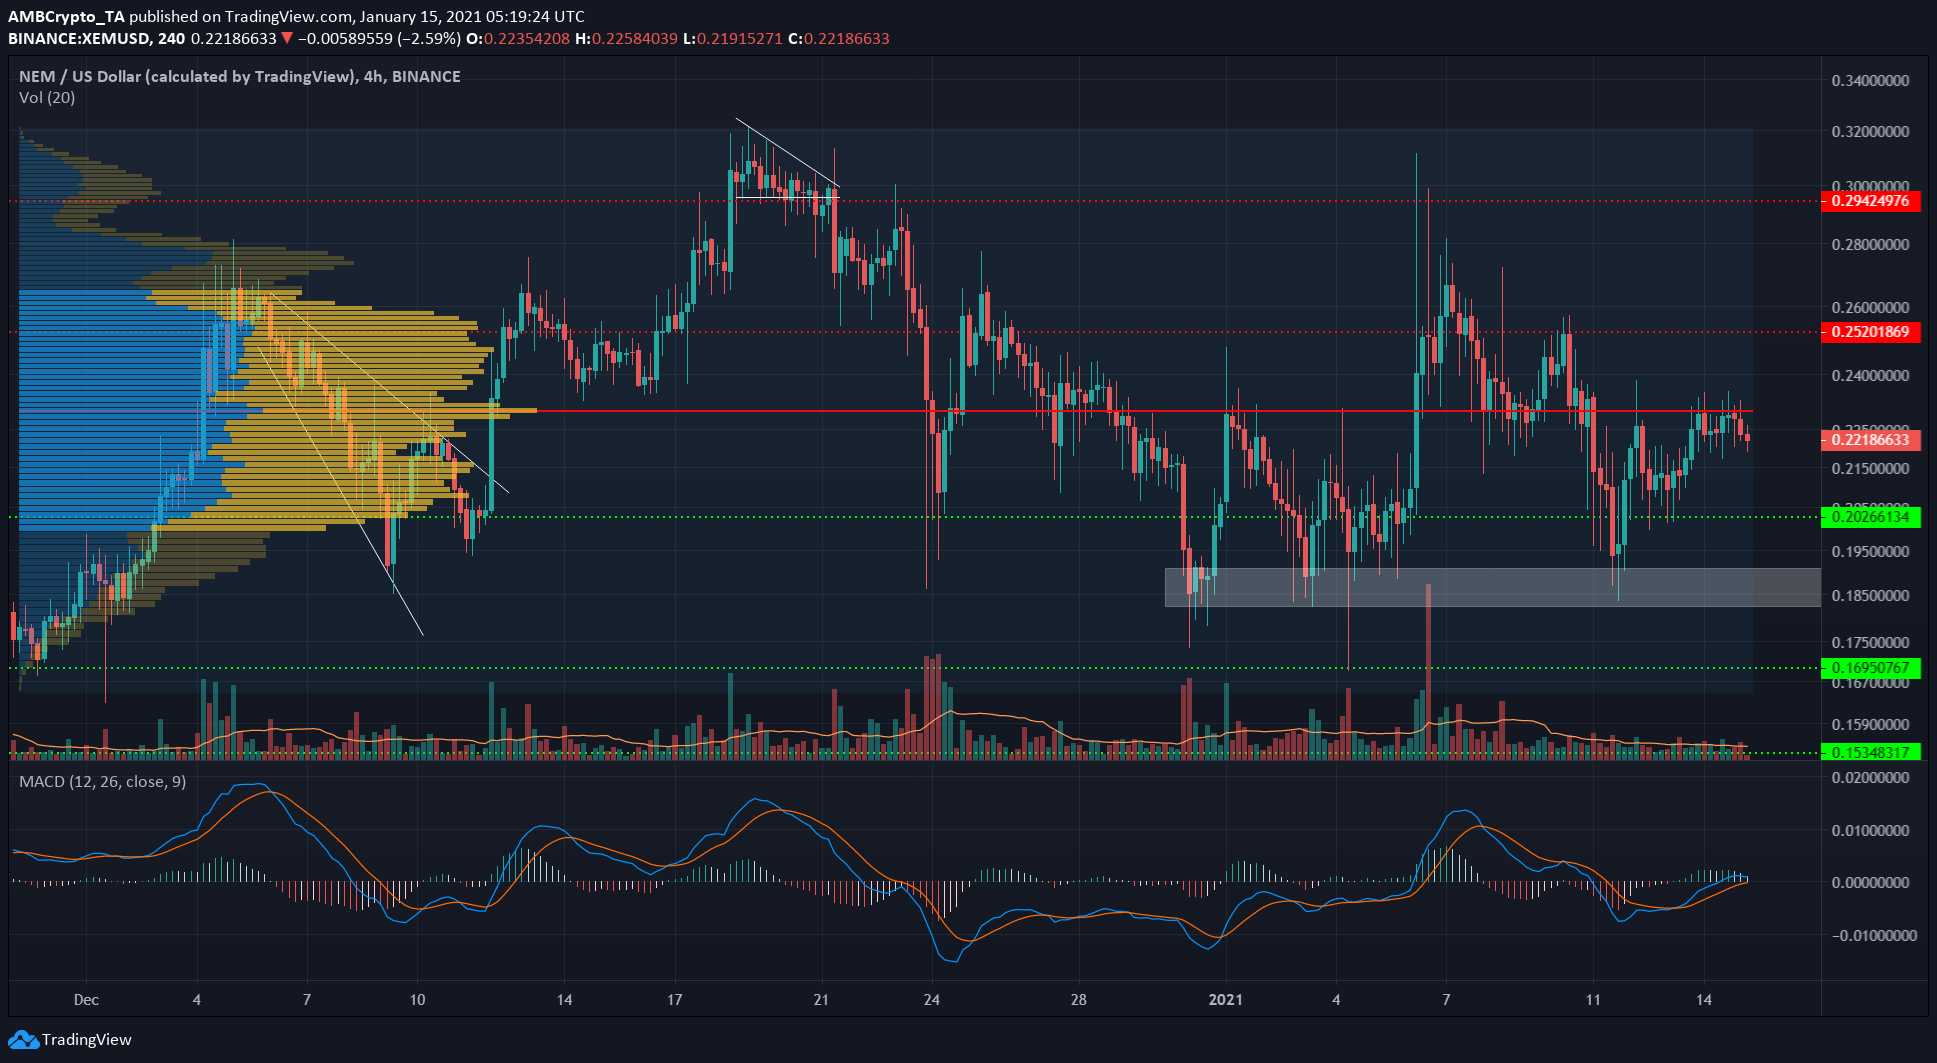
Source: XEM/USD on TradingView
The Fixed Range Volume Profile for XEM showed that the $0.2 and $0.25-levels of support and resistance, respectively, have been of crucial importance to the price. It highlighted the Point of Control to be at the $0.23-mark.
Hence, a rejection at or a move above the PoC would dictate the short-term direction of the XEM market.
The 4-hour chart's MACD noted that the momentum had stalled over the past couple of days as the price was unable to push past $0.23. This rejection implied that $0.215 and $0.2 were the targets for the bears.
Zcash [ZEC]
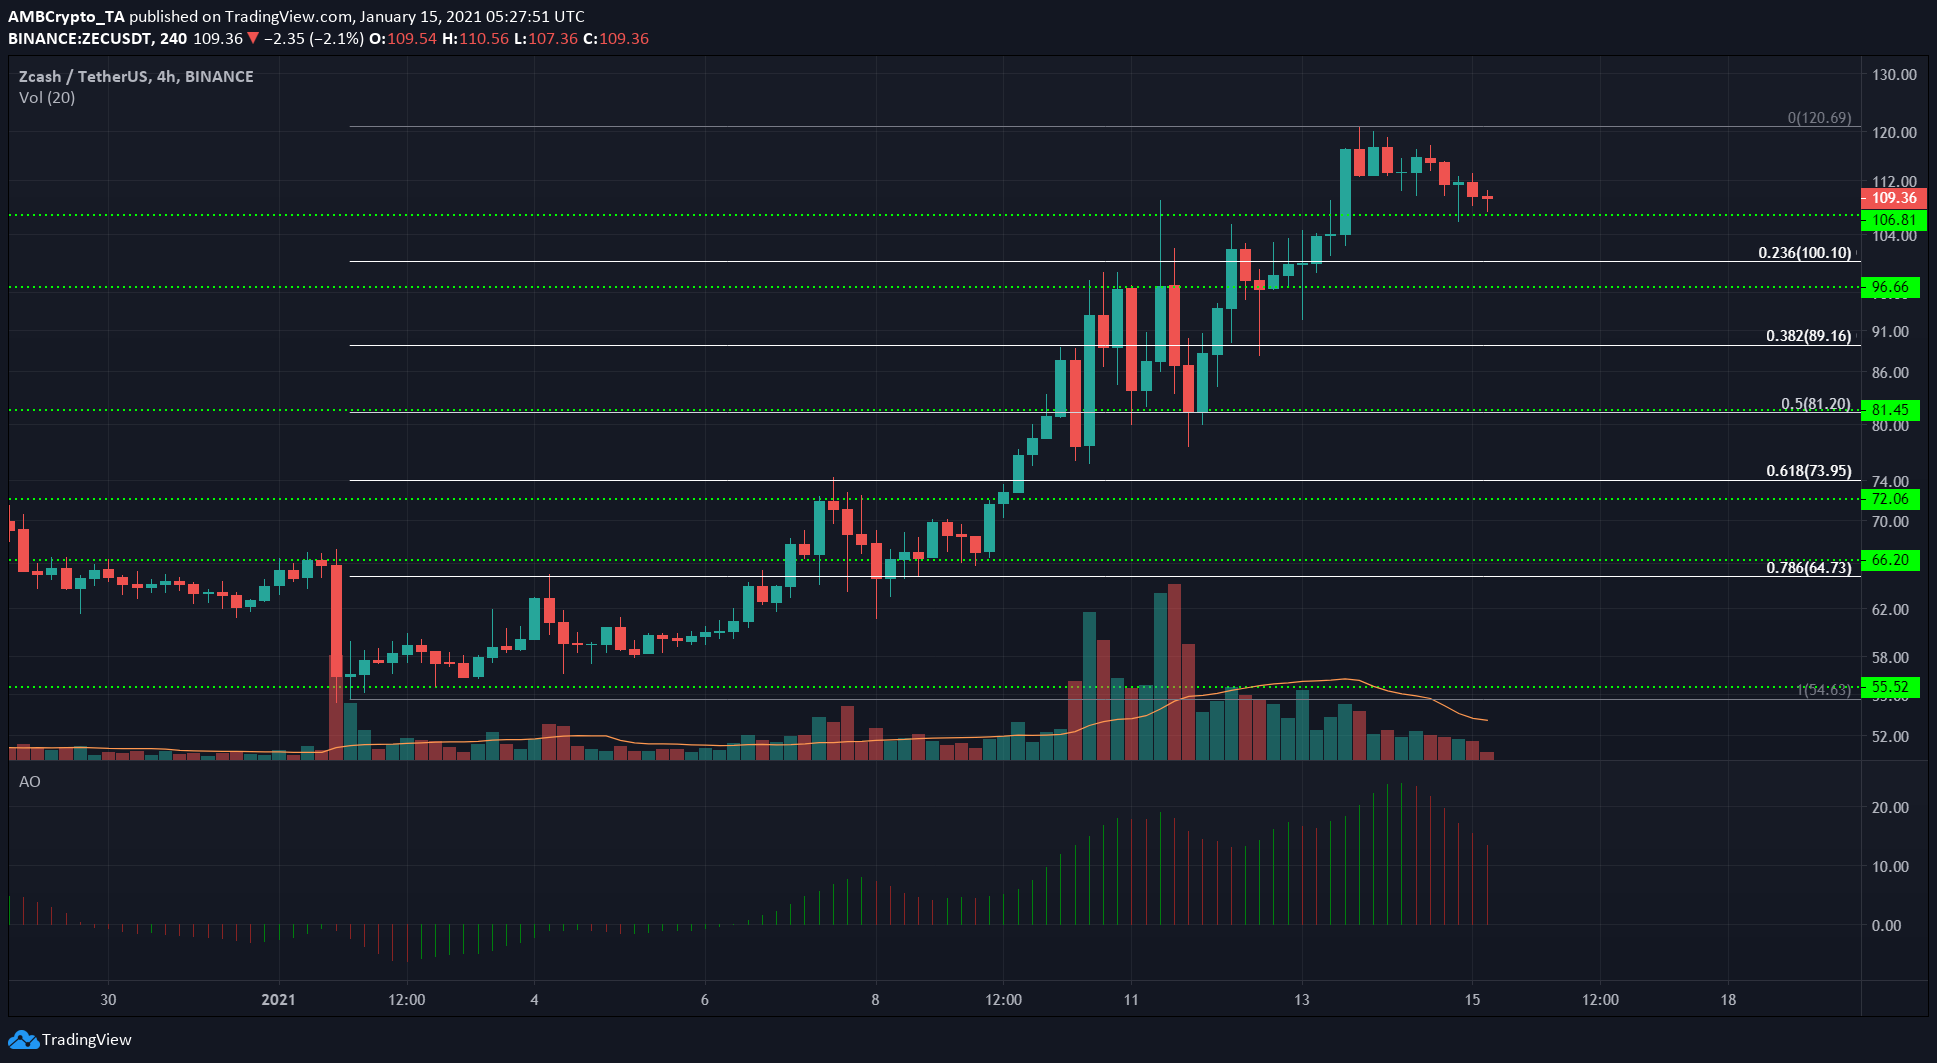
Source: ZEC/USDT on TradingView
Using the Fibonacci retracement tool for ZEC's move from $54.6 to $120.6, some important levels of retracement were highlighted. The region between $96.6 and $100 can be expected to offer support if the price dips.
At the time of writing, the $109-support level held strong, even though the Awesome Oscillator showed that bullish momentum was waning.
A close below $109 can see ZEC dip towards $100.
The post Stellar Lumens, NEM, Zcash Price Analysis: 15 January appeared first on AMBCrypto.
3y ago
bullish:
2
bearish:
1
Share


 Manage all your crypto, NFT and DeFi from one place
Securely connect the portfolio you’re using to start.

bullish:
0
bearish:
1


