Enjin Coin Price Analysis - ENJ Looking To Continue Bull Run As They Eyeball Break Above $0.22.
4y ago
bullish:
4
bearish:
0
Share
Key Highlights:
- Enjin Coin saw a 4.7% price climb over the past 24 hours of trading as it reaches $0.203.
- ENJ must now close above $0.22 to continue its previous bullish run.
- Against BTC, ENJ has dropped from the 2500 SAT May high to reach the current 2100 SAT level.
| ⠀Enjin price: | $0.204 |
|---|---|
| ⠀Key ENJ resistance levels: | $0.22, $0.226, $0.24, $0.2445, $0.251 |
| ⠀Key ENJ support levels: | $0.2, $0.188, $0.18, $0.171, $0.16 |
*price at the time of writing
Enjin saw a small 4.7% price increase over the past 24 hours of trading as the cryptocurrency tries to kick start another bullish run and push higher above $0.22. The cryptocurrency surged from as low as $0.13 during May 2020 and went on to reach as high as $0.24 before rolling over and falling.
During the entire period of June 2020, ENJ has been trading within a range between $0.22 and $0.188 and must break away from this range to dictate the next direction that ENJ would like to head toward.
Enjin has been enjoying some strong developmental updates over the past few weeks. It had recently released the Enjincraft Plugin that allows users to quickly integrate ENJ into their Minecraft servers.
With the EnjinCraft plugin, you can deliver blockchain assets directly to players. You're free to create custom new items—or use ones that already exist, like the Epochrome Sword.
— Enjin (@enjin) June 4, 2020
⏯️ Here's how it works: https://t.co/bSp4oYHQRe#Minecraft #MinecraftBuilds #Ethereum pic.twitter.com/cLw2R81ytL
In addition to this, many gamers are anticipating the release of Disruption, a VR supported blockchain-based game, to Steam pretty soon when they officially launched alterverse.com;
Create and control your own world in AlterVerse: Disruption—coming soon to Steam with multiple game modes and VR support.
— Enjin (@enjin) June 6, 2020
Check out pre-alpha and let the dev team at @AlterVerseGame know what you think! https://t.co/Hpvu7zAiOk#screenshotsaturday #indiedev #oculus #vive pic.twitter.com/Sy1AxP5UPM
ENJ has also been on the climb against BTC itself. The coin had shrugged from a low of around 1500 SAT in early May to climb as high as 2500 SAT by the end of the month. The coin has since dropped lower from here as it battles to fund support at the 2000 SAT level. It did recently bounce from 2000 SAT as it reaches the 2100 SAT region today.
Enjin Coin is now ranked in the 48th position as it presently holds a market cap ranking of $167 million.
Enjin Coin Price Analysis
What has been going on?
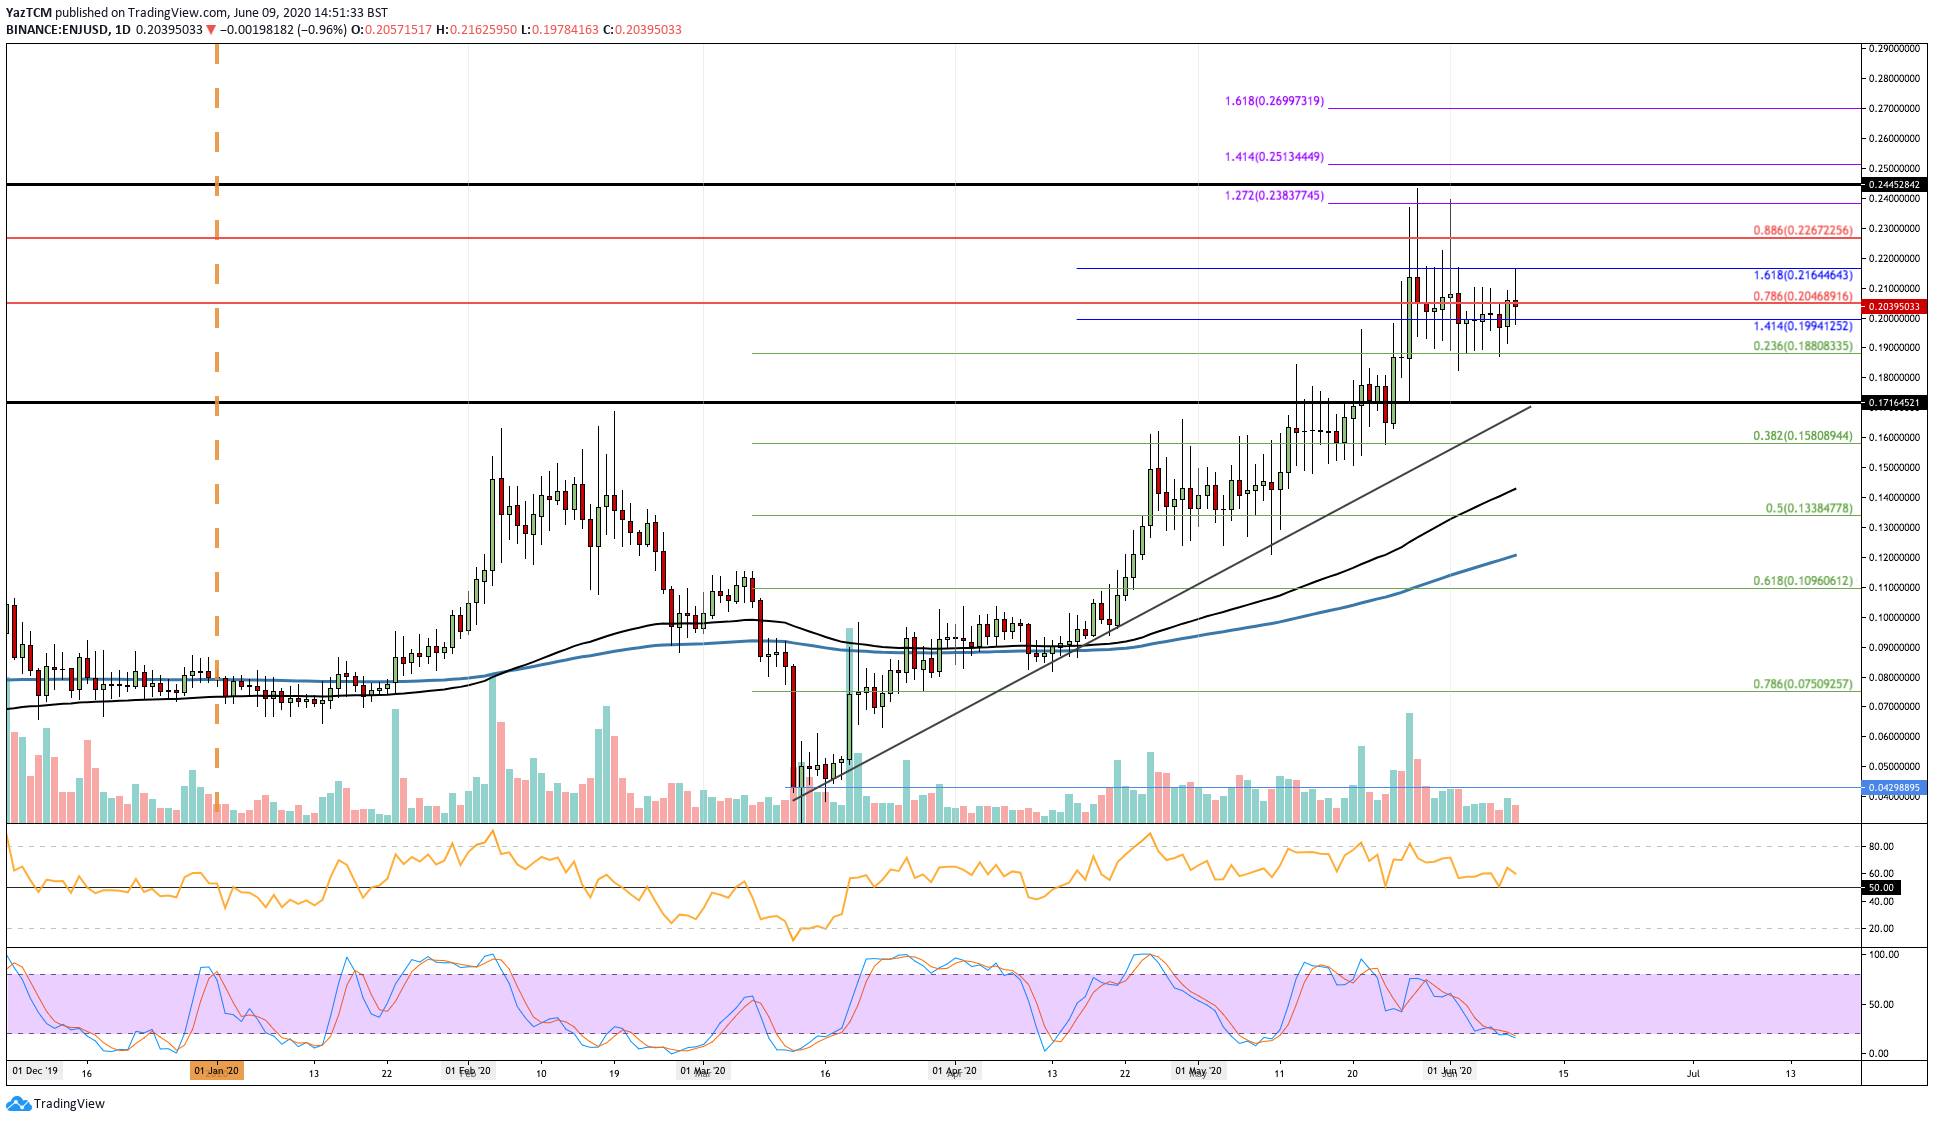
Taking a look at the daily chart above for ENJ we can see that the coin was trading at the 200-day EMA at around $0.09 during April 2020. It surged from here in mid-April 2020 as it went on to reach as high as $0.16 by the end of the month.
During May 2020, ENJ was trading sideways between $0.13 and $0.16 for the first 2 weeks of the month. It went on to break above $0.16 during mid-May 2020 and started to push higher from here.
It had managed to reach as high as $0.24 toward the end of May 2020 and eventually ended the month at around the $0.2 level.
During June 2020, we can see that ENJ has been trading sideways between $0.22 and $0.188 (.236 Fib Retracement level).
Enjin Coin price short term prediction: Bullish
Although ENJ is bullish in the short term, we must break above $0.22 for this bullish run to continue higher. ENJ would need to drop beneath $0.188 to turn neutral and would have to continue further lower beneath $0.158 to turn bearish in the short term.
If the sellers step in and push the market lower, the first level of strong support lies at $0.2. Beneath this, support lies at $0.188 (.236 Fib Retracement), $0.18, $0.171, and $0.158 (.382 Fib Retracement).
Where is the resistance toward the upside?
On the other hand, the first level of resistance lies at $0.22. Above this, resistance is to be expected at $0.226 (bearish .886 Fib Retracement), $0.23, $0.238, and $0.245.
If the bulls continue to push higher above $0.25, resistance then lies at $0.251, $0.26, $0.27 (1.618 Fib Extension), and $0.28.
What are the technical indicators showing?
The RSI is falling but still remains above the 50 line to indicate that the buyers are controlling the market momentum. So long as the RSI can remain above 50 during this retracement, we can expect ENJ bulls to push higher.
What has been going on?
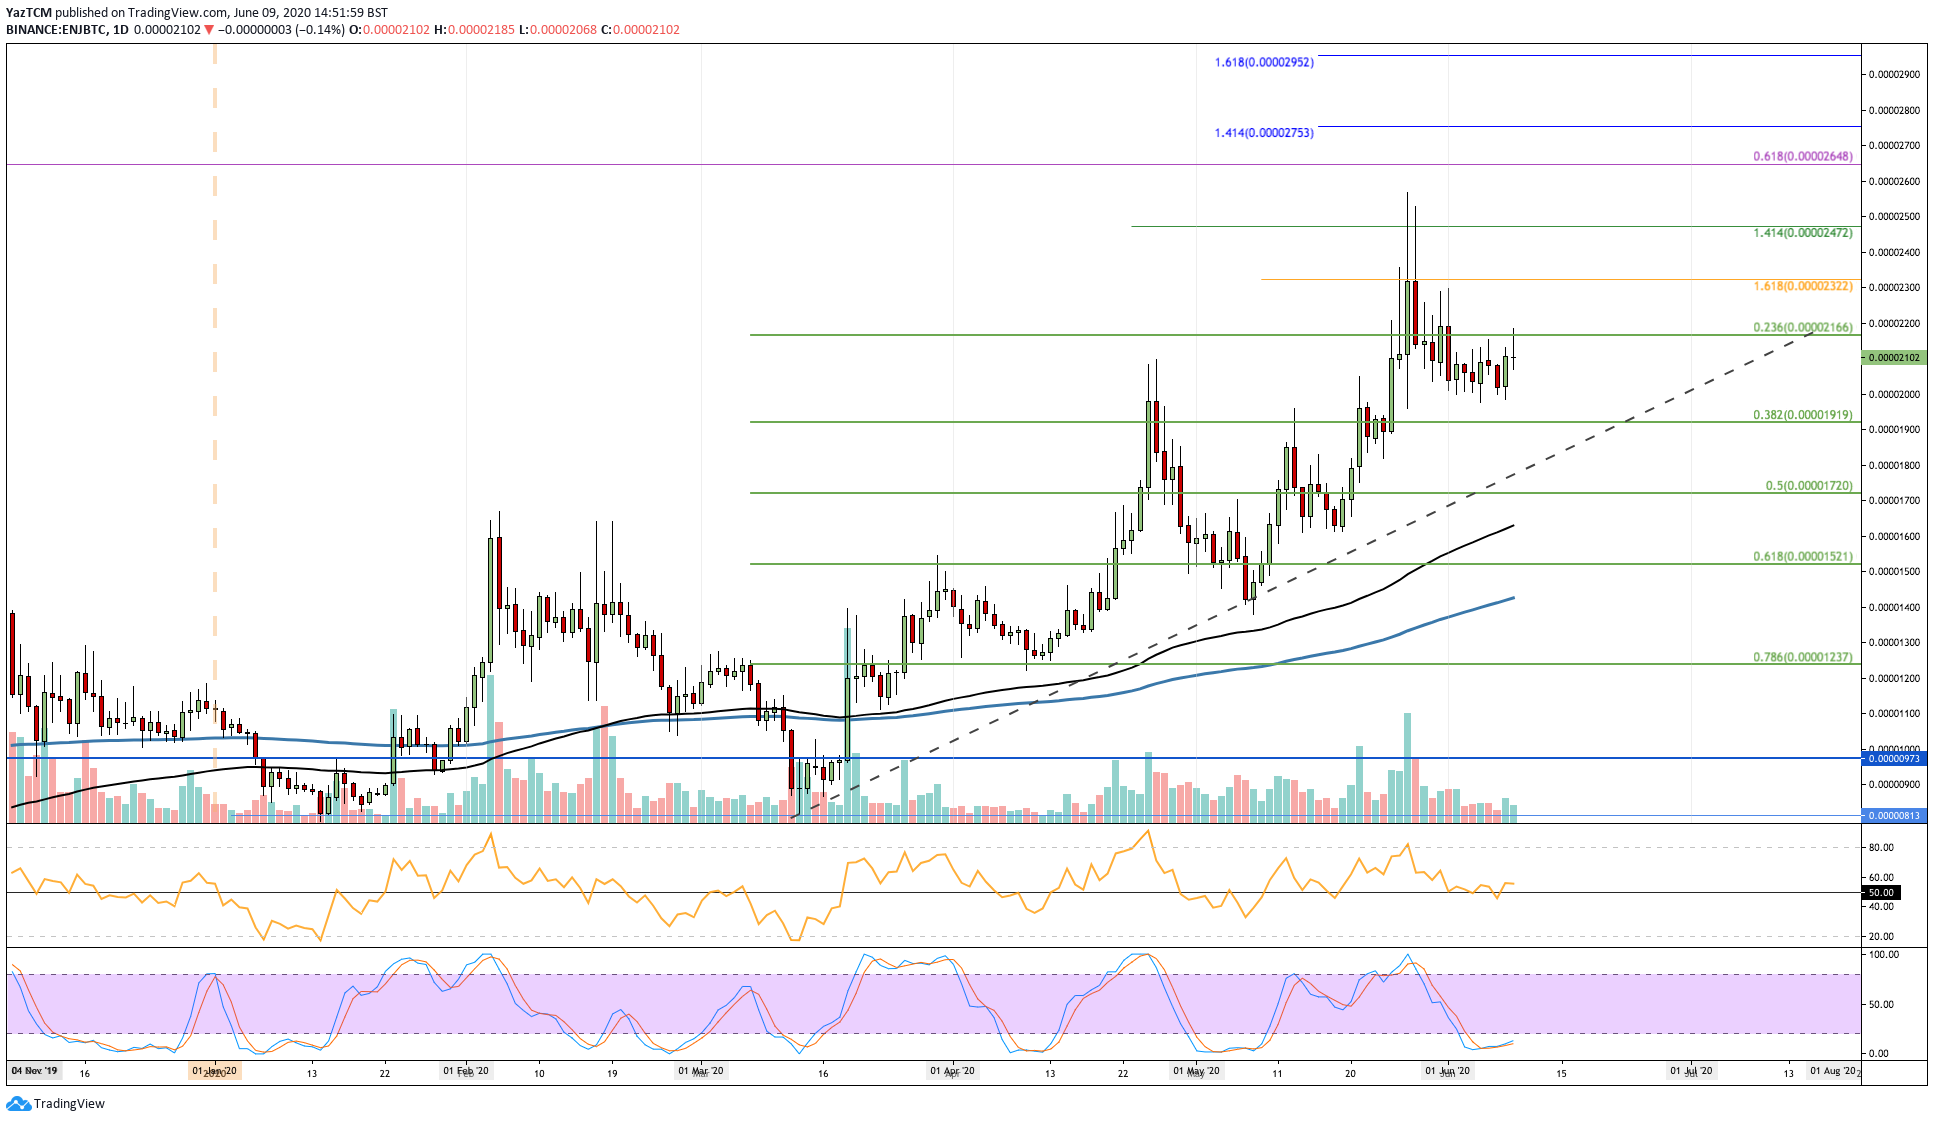
Against Bitcoin, we can see that ENJ has dropped lower from the May 2020 high of around 2500 SAT. The coin had dropped as low as 2000 SAT in June as it recently rebounded from here to reach the 2100 SAT level.
ENJ/BTC price short term prediction: Bullish
ENJ is bullish in the short term but the coin would have to rise above the 2300 SAT level for this bullish trend to continue higher. ENJ would need to drop beneath 2000 SAT to turn neutral and would have to fall beneath 1900 SAT to turn bearish in the short term.
If the sellers do push ENJ lower, the first level of support lies at 2000 SAT. Beneath this, support lies at 1920 SAT (.382 Fib Retracement), 1800 SAT, 1720 SAT (.5 Fib Retracement), and 1650 SAT (100-day EMA).
Added support lies at 1600 SAT, 1520 SAT (.618 Fib Retracement), and 1400 SAT (200-day EMA).
Where is the resistance toward the upside?
On the other hand, the first level of resistance lies at 2200 SAT. Above this, resistance lies at 2300 SAT, 2400 SAT, 2472 SAT, 2500, 2600 SAT, and 2650 SAT.
Added resistance lies at 2750 SAT, 2800 SAT, and 2900 SAT.
Previous ENJ analysis
At CoinCodex, we regularly publish price analysis articles focused on the top cryptocurrencies. Here's 3 of our most recent articles about the price of Enjin:
4y ago
bullish:
4
bearish:
0
Share


 Manage all your crypto, NFT and DeFi from one place
Securely connect the portfolio you’re using to start.

bullish:
0
bearish:
0

bullish:
0
bearish:
0

bullish:
0
bearish:
0

bullish:
0
bearish:
0