ChainLink Price Analysis - LINK Meets Resistance At $10.77 As Descending Triangle Consolidation Appears - Potential Trading Opportunity?
4y ago
bullish:
0
bearish:
1
Share
Key Highlights:
- ChainLink saw a 4.10% price fall today as the coin hits $10.20. Despite this recent downtrend, ChainLink is still up by a total of 15.5% over the past week of trading.
- There is a descending triangle on the 4HR charts that presents an opportunity to go short if we break beneath the lower boundary.
- Against Bitcoin, ChainLink had surged higher to ₿0.00101 but failed to break the resistance at the bearish .618 Fib Retracement.
| ⠀ChainLink price: | $10.20 |
|---|---|
| ⠀Key LINK resistance levels: | $10.77, $12, $12.67, $13, $14.20 |
| ⠀Key LINK support levels: | $10, $9.71, $9.25, $9.15, $8.80 |
*Price at the time of writing
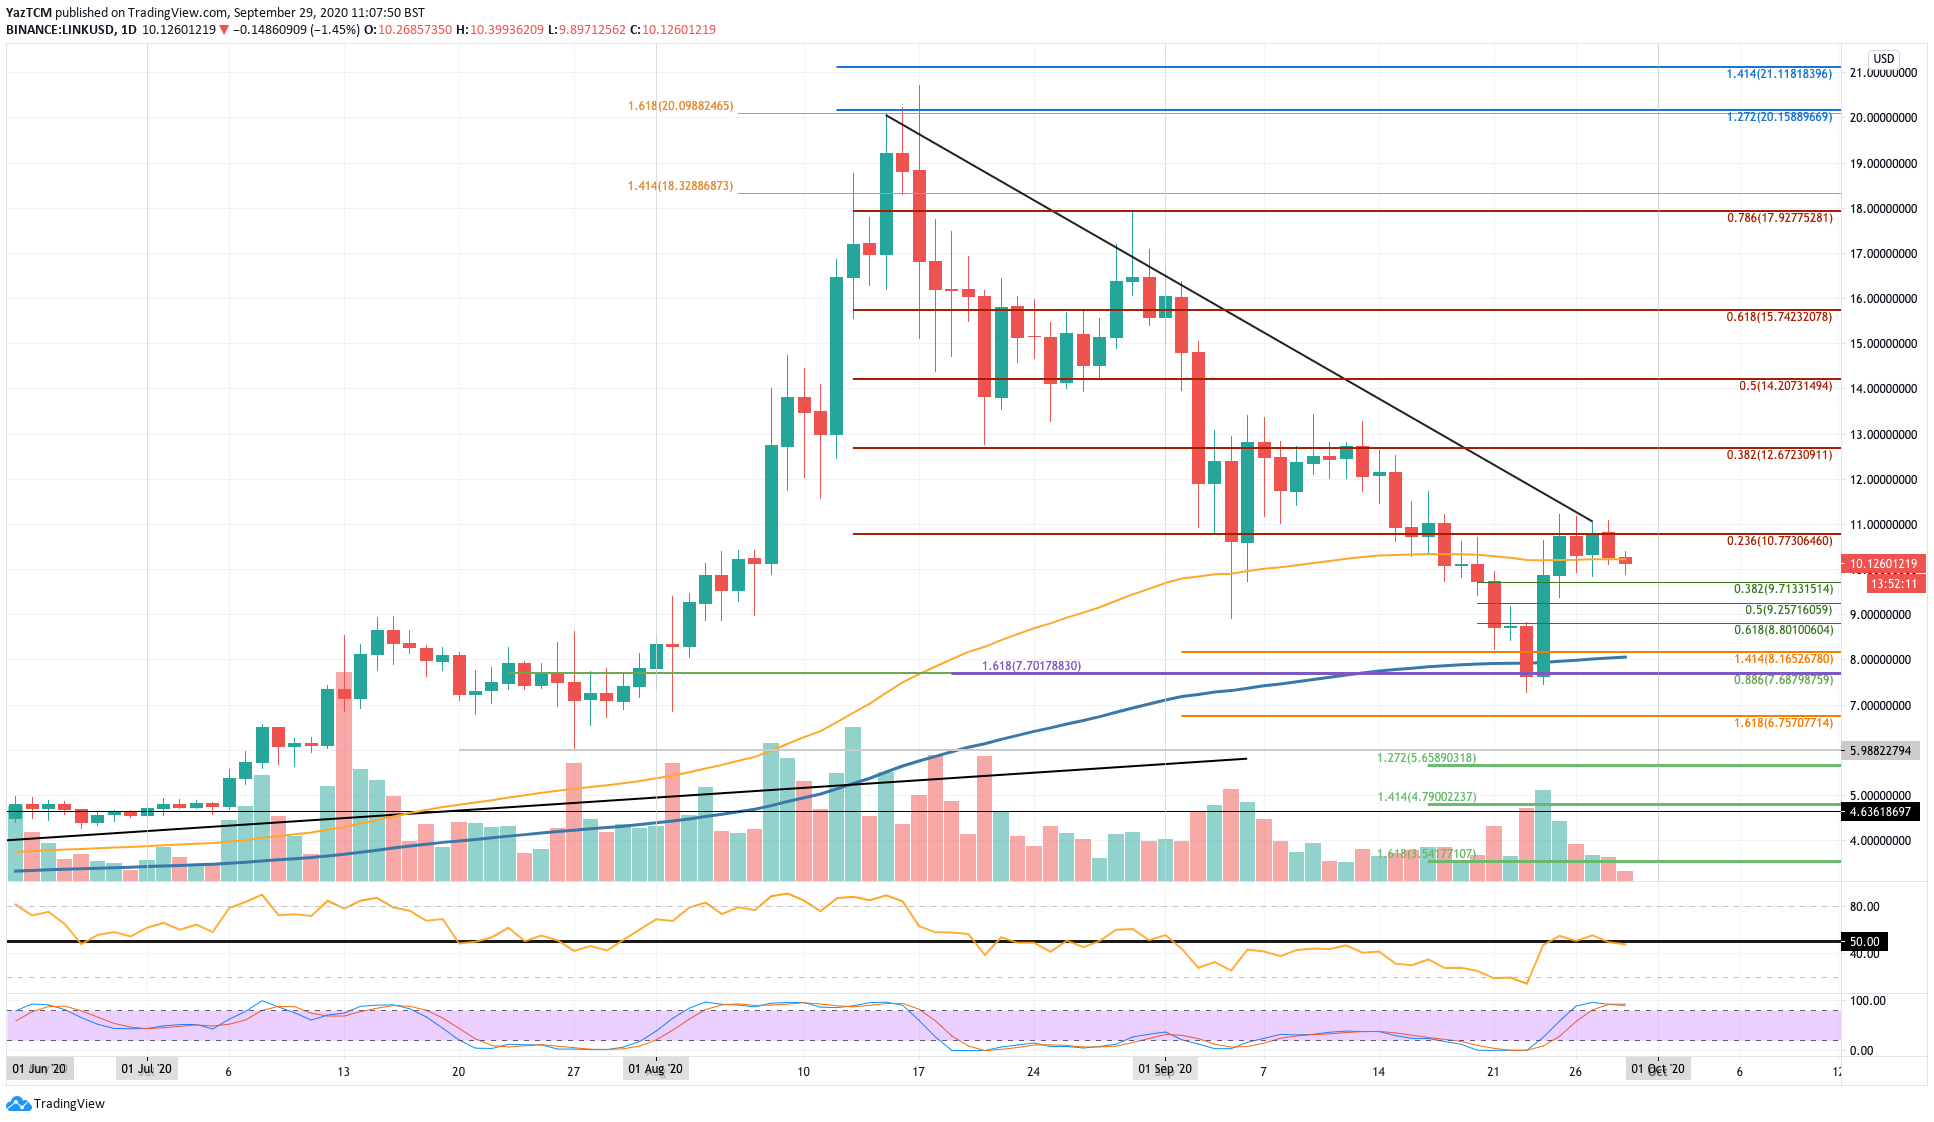
ChainLink has been struggling as of late and has been in a solid decline since it peaked at around $20 in August 2020. In fact, the cryptocurrency is actually down by a total of around 33% over the past month alone.
Nevertheless, last week, the buyers did initiate somewhat of a rebound higher when the bulls hit the support at around $7.70 and pushed higher. They managed to push as high as $10.77, where they ran into resistance at a bearish .236 Fib Retracement level. The bulls have attempted to break this resistance over the weekend and have failed to do so which has caused LINK to drop toward $10.12 as it trades along with the 100-day EMA level.
As a result of this short-term consolidation, there is a descending triangle forming on the 4HR charts which might present a trading opportunity for those looking to go short. We will cover this in the analysis below.
There has not been too much news for LINK through the wire and this seems to be reflected in the Network Growth metric presented by Santiment:
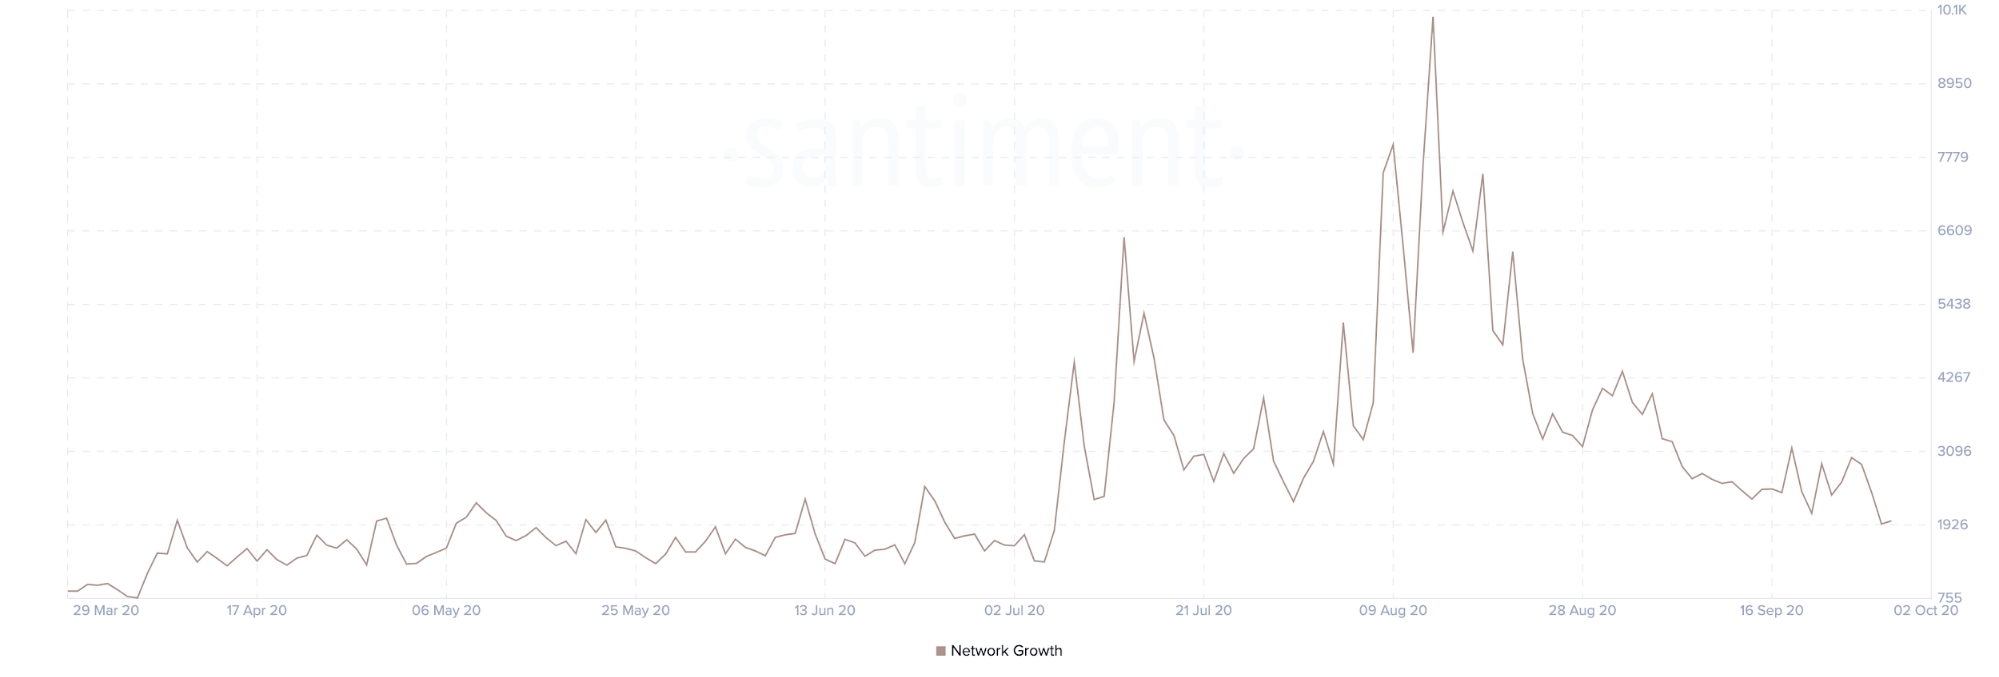
We can see that the Network Growth has been dropping since August and the ChainLink ecosystem is growing at the same levels that it was during May and June 2020. This Network Growth is taken from other metrics such as the Active Addresses which is showing a similar pattern:
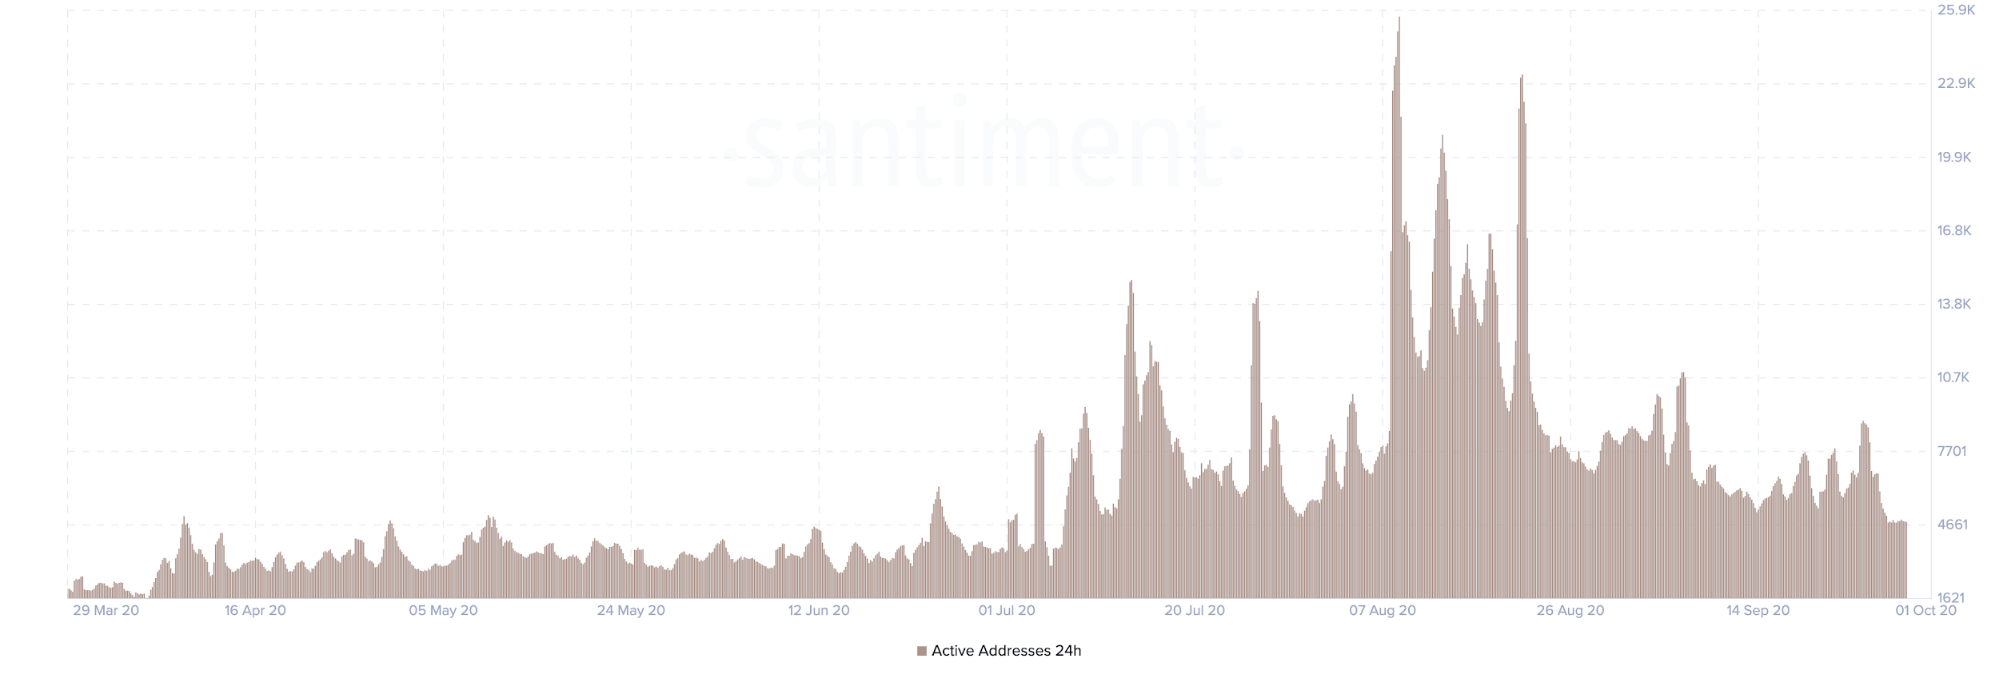
We can see that the total number of Active Addresses has dropped significantly from the August highs as fewer people seem to be moving their LINK around.
Lastly, taking a look at the MVRV (30-day) metric from Santiment, we can see that LINK holders are now just in a 0.85X profit:
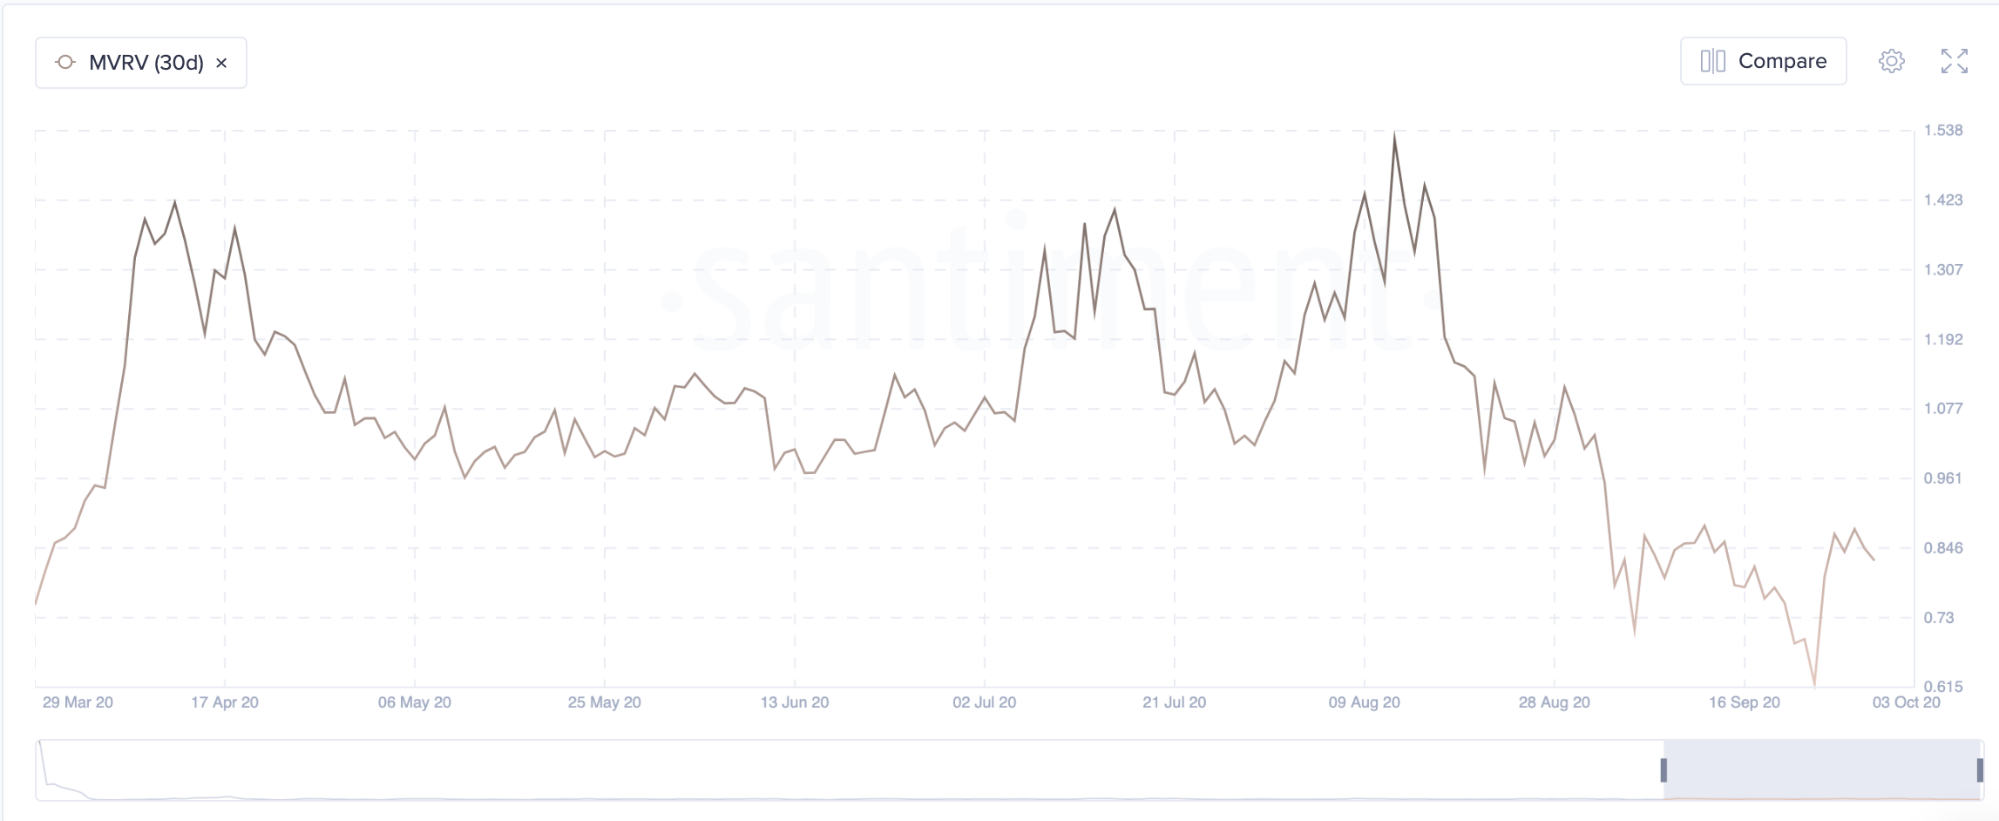
This metric shows the average profit of loss for LINK holders that moved coins in the past 30-days. We can see that it has slipped from the 1.53X profit they had during the August peak.
Let us take a look at the charts and have a look at the potential trading opportunity. First, we will cover LINK on the daily charts and then present some perfect targets to go short if LINK breaks the triangle.
ChainLink Price Analysis
What has been going on?
Taking a look at the daily chart above, we can clearly see the steep price decline over the past one and a half months of trading for LINK. The coin has dropped from $20 to reach as low as $7.70 last week.
The support at $7.70 is provided by a .886 Fib Retracement and is further bolstered by the 200-day EMA. After hitting this support, LINK bounced toward the end of last week as it pushed higher into the $10.77 level where it found resistance at a bearish .236 Fib Retracement. This area of resistance is further bolstered by a rising trend line that has dictated the market since the August peak.
LINK price short term prediction: Neutral
LINK can be considered as neutral right now, however, a break beneath the $7.70 support is likely to turn the coin bearish. It would still have to rise beyond the $14.20 resistance before we can start the conversation of turning bullish again.
If the sellers head lower, the first level of support lies at $10. Beneath this, support is located at $9.71 (.382 Fib), $9.25 (.5 Fib), and $8.80 (.618 Fb). Beneath this, added support lies at $8.00 (200-day EMA), $7.68 (.886 Fib Retracement), and $7.00.
Where is the resistance toward the upside?
On the other side, the first level of resistance to break lies at $10.77 (bearish .236 Fib Retracement). Above this, resistance lies at $12, $12.67 (bearish .382 Fib Retracement), $13, and $14.20 (bearish .5 Fib Retracement).
Trading Opportunity
As mentioned, there is a trading opportunity available for traders that are willing to go short. The consolidation over the weekend has allowed for the following descending triangle pattern to form on the 4HR charts:
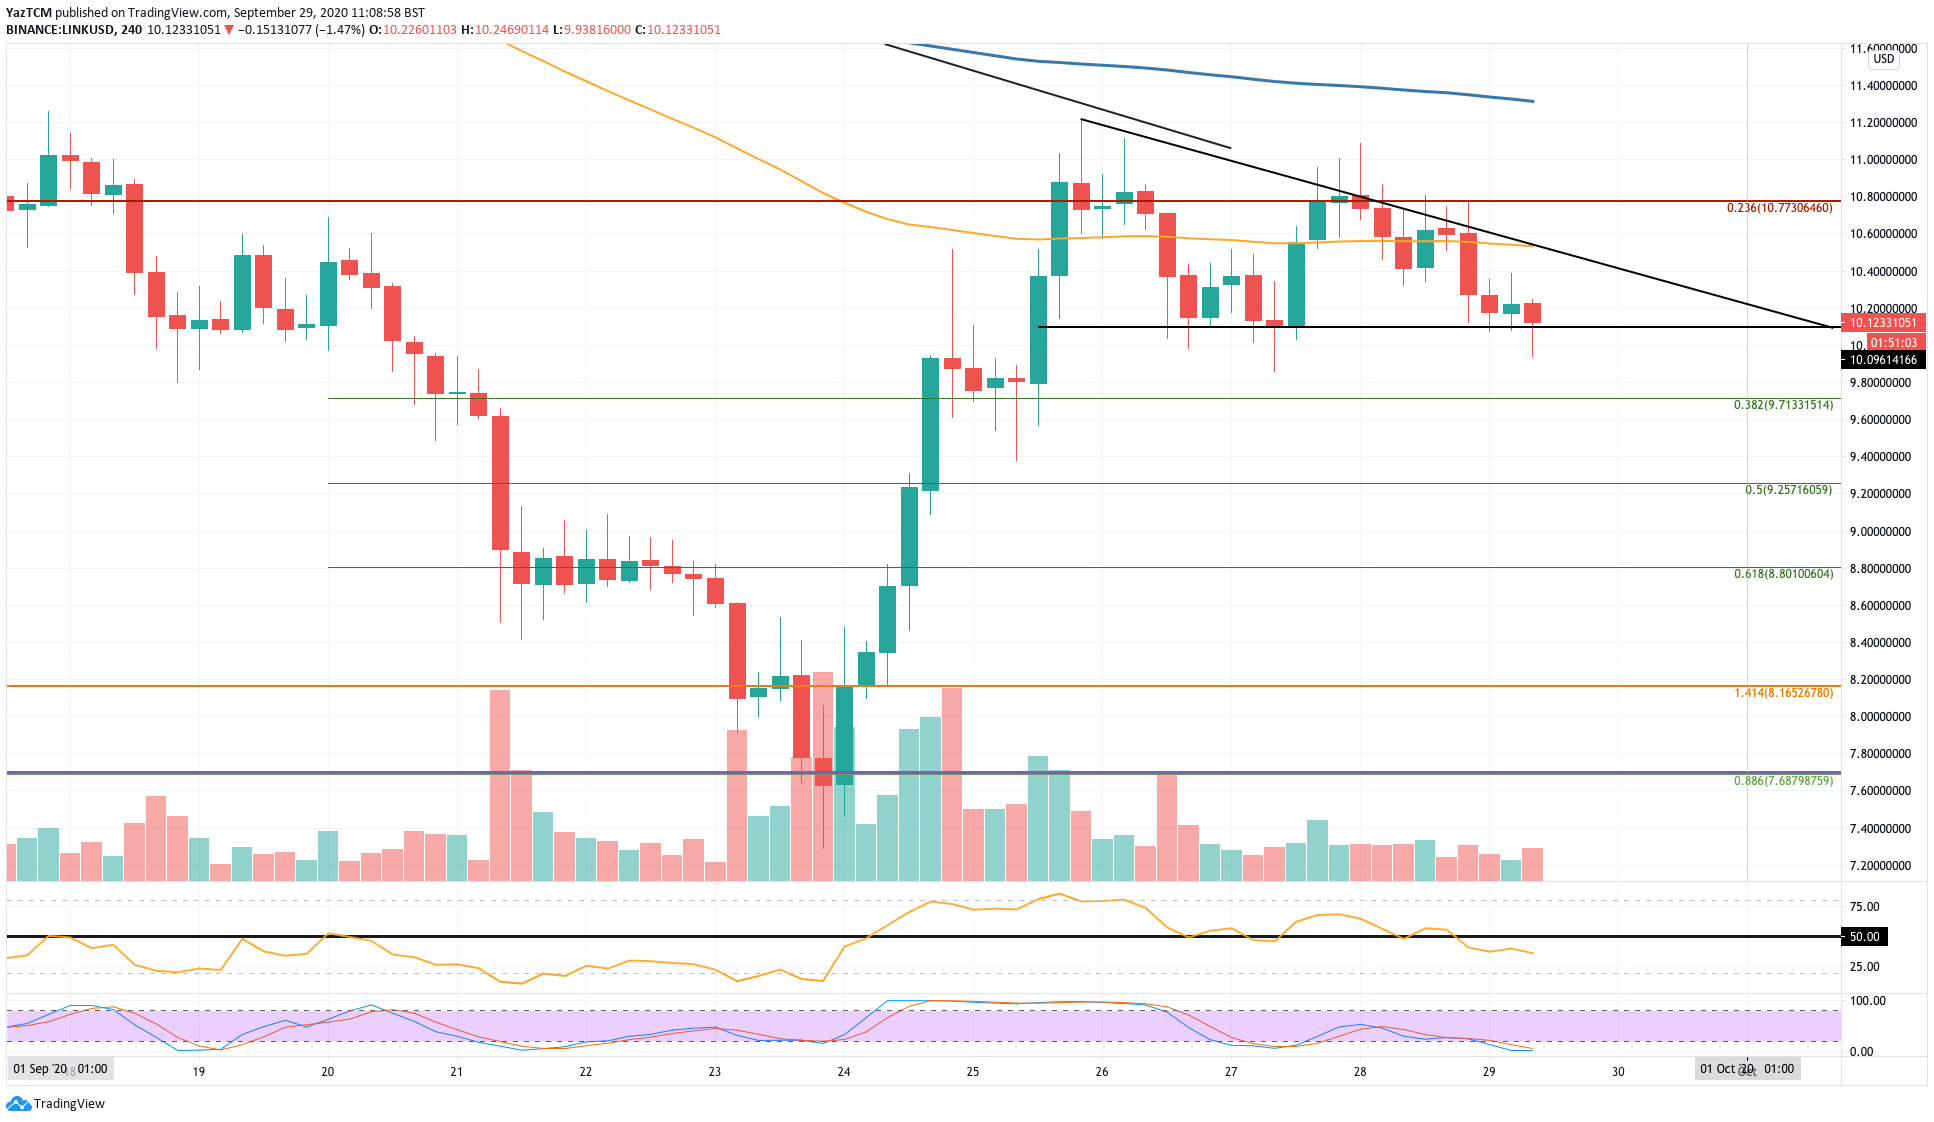
The base of this triangle is pretty much at $10. Typically, descending triangles break toward the downside and it is looking highly likely in this case.
If LINK breaks the lower boundary of the triangle we have the opportunity to go short. You can do this on derivatives platforms such as FTX exchange.
In this case, we go short at $10 and set targets beneath here. Some great targets are outlined by the Fibonacci Retracements. If you think LINK will only see a shallow dip then the .382 Fib Retracement at $9.71 is a great location. However, this will not yield a great profit.
Alternatively, $9.25 (.5 Fib Retracement) and $8.80 (.618 Fib Retracement) also provide viable targets.
If you are bearish on LINK - you should be right now - you could even hold your trade until $7.70 is hit again and see if the market rebounds from there.
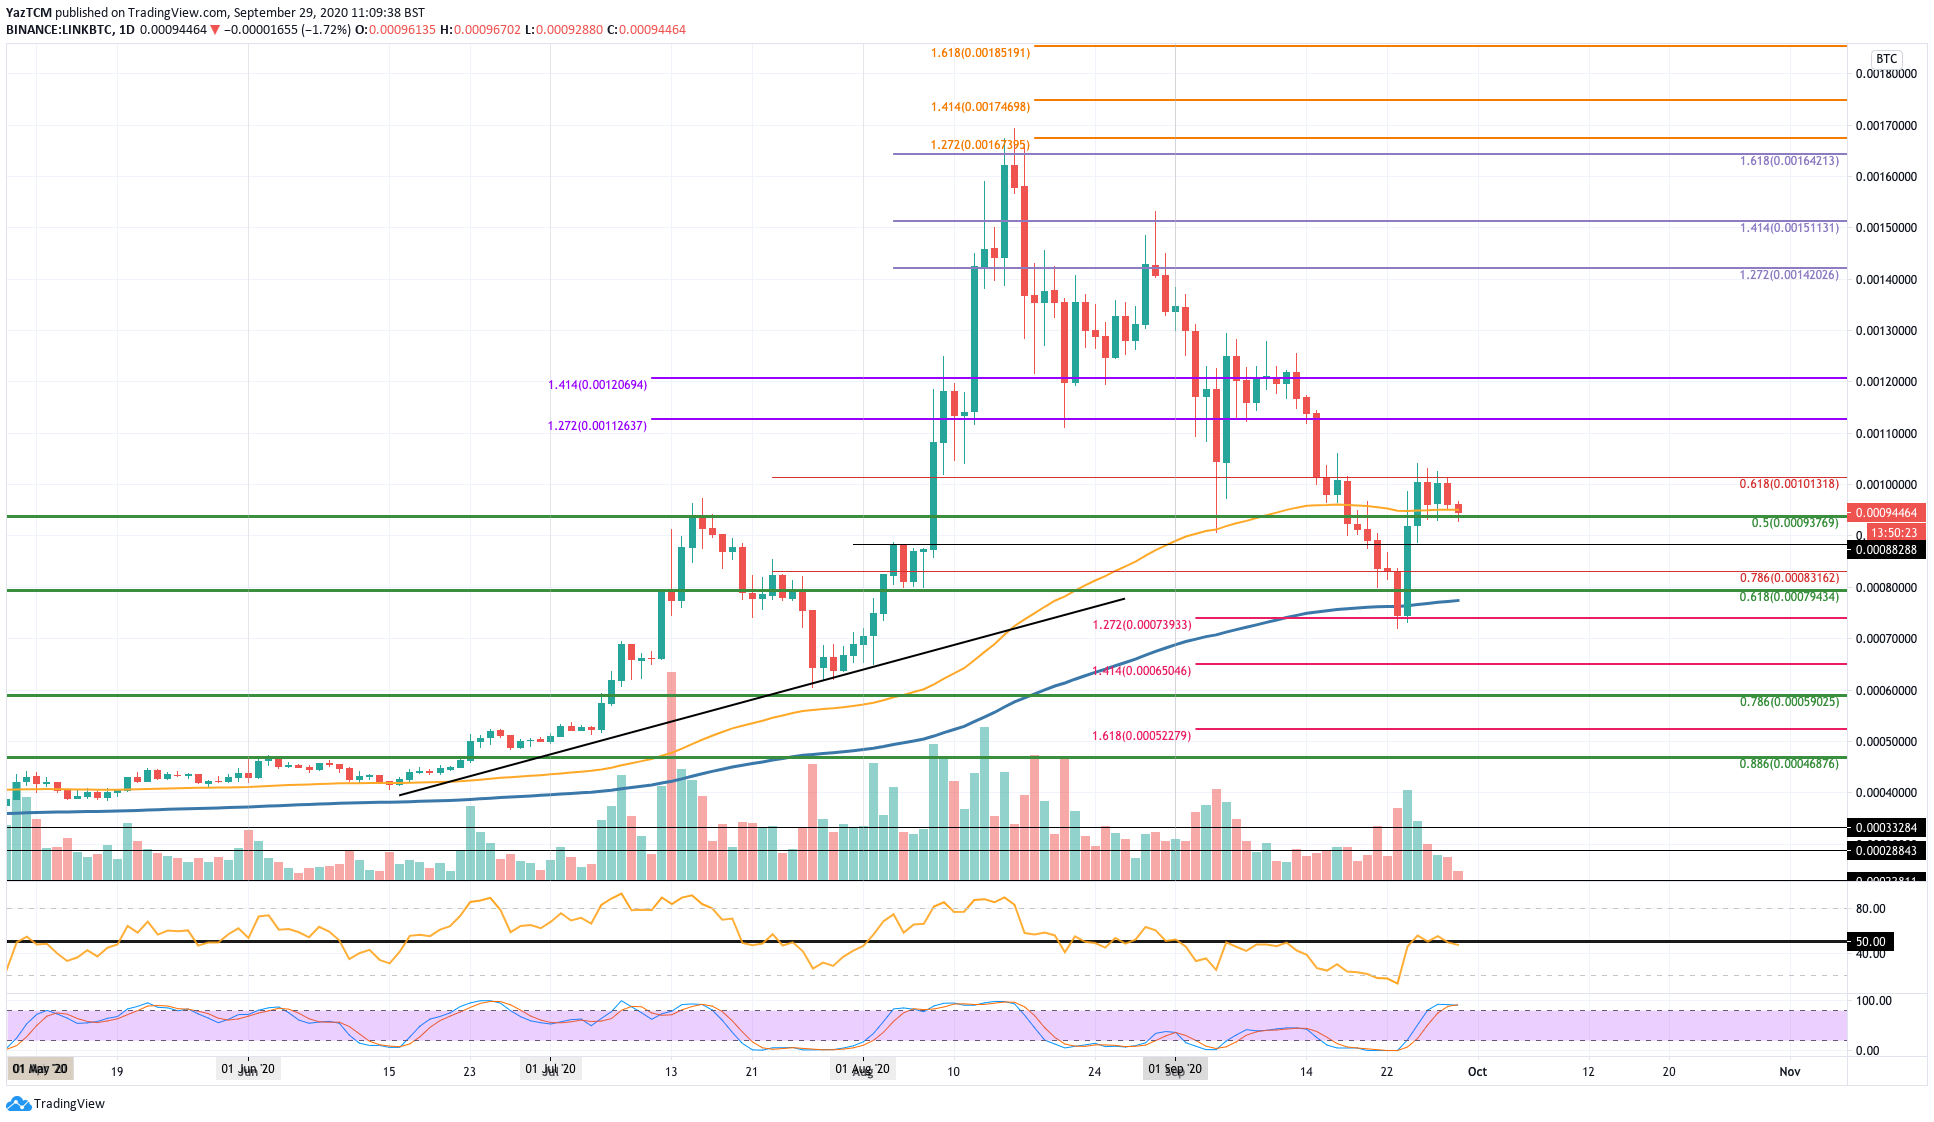
What has been going on?
Against Bitcoin, LINK is in a similar depressing boat which is sinking. The coin has dropped from as high as ₿0.00164 in August to reach as low as ₿0.000739 (downside 1.272 Fib Extension) last week.
It rebounded from here to reach the resistance at ₿0.00101 (bearish .618 Fib Retracement) over the weekend.
LINK/BTC price short term prediction: Neutral
LINK is also neutral against BTC and would need to break beyond ₿0.0013 to turn bullish. A break beneath ₿0.000739 is likely to turn the market bearish.
If the sellers push beneath the current support at ₿0.000937, additional support lies at ₿0.000882, ₿0.000831, and ₿0.0008 (.618 Fib Retracement). Added support lies at the 200-day EMA, ₿0.000739 (downside 1.272 Fib), and ₿0.0007.
Where is the resistance toward the upside?
On the other side, the first level of resistance lies at ₿0.00101 (bearish .382 Fib). Above this, resistance lies at ₿0.00112, ₿0.0012, and ₿0.0013.
Previous LINK price analysis
At CoinCodex, we regularly publish price analysis articles focused on the top cryptocurrencies. Here's 3 of our most recent articles about the price of ChainLink:
4y ago
bullish:
0
bearish:
1
Share


 Manage all your crypto, NFT and DeFi from one place
Securely connect the portfolio you’re using to start.

bullish:
0
bearish:
0


bullish:
0
bearish:
0
