Bitcoin price taps $9100 support: uptrend next?
4y ago
bullish:
9
bearish:
3
Share

The Bitcoin price rose across the $9360 level on the 20th of June. Crypto analysts on TradingView believe that BTC price will see an uptrend soon.
1-Day Bitcoin price analysis (20th June)
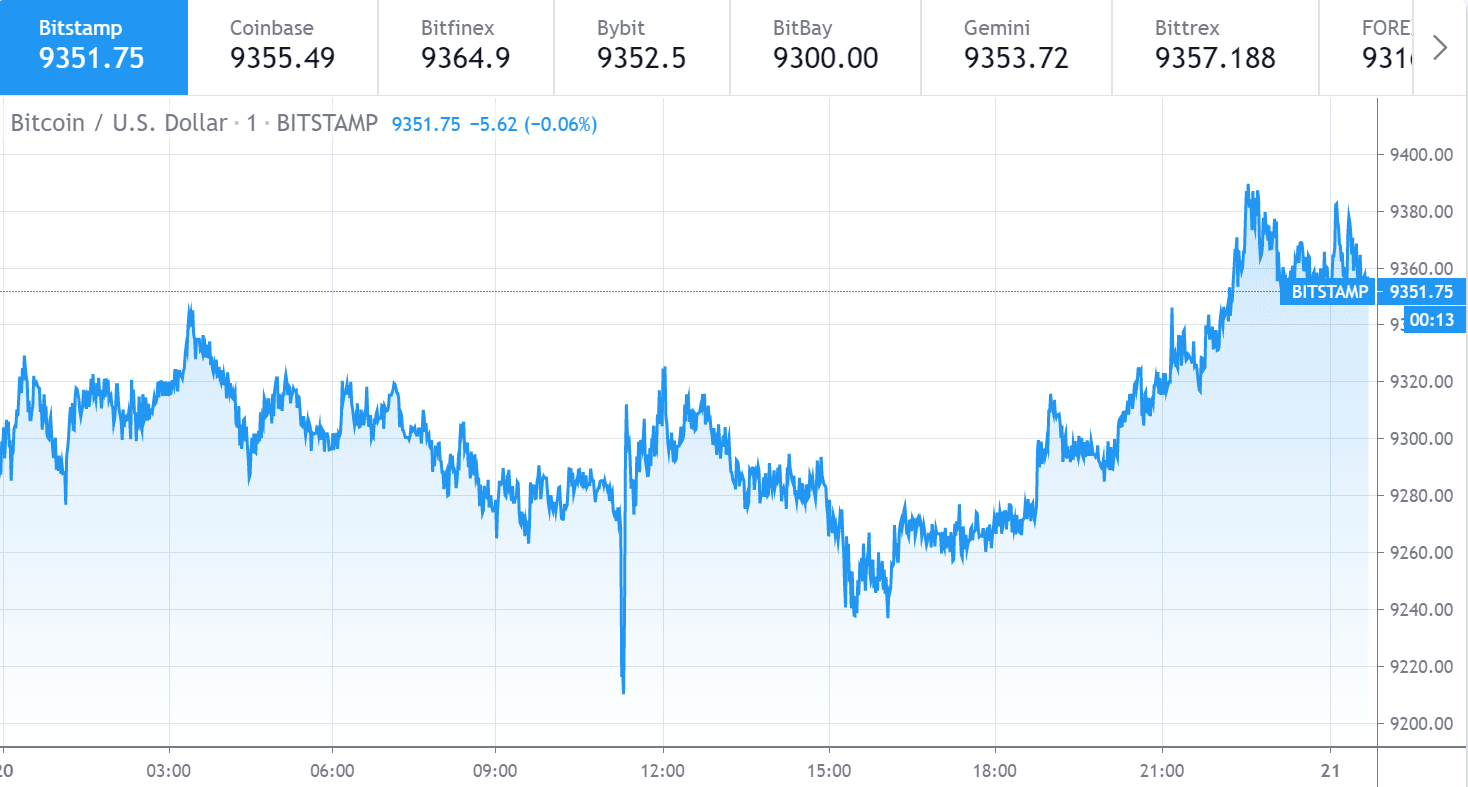
Bitcoin Price Chart by Trading View
The BTCUSD pair was observed at $9351.75 US Dollars at the time of writing.
Bitcoin: descending parallel channel?
Rajeev Kumar is a TradingView analyst that believes that BTC price will see an uptrend soon.
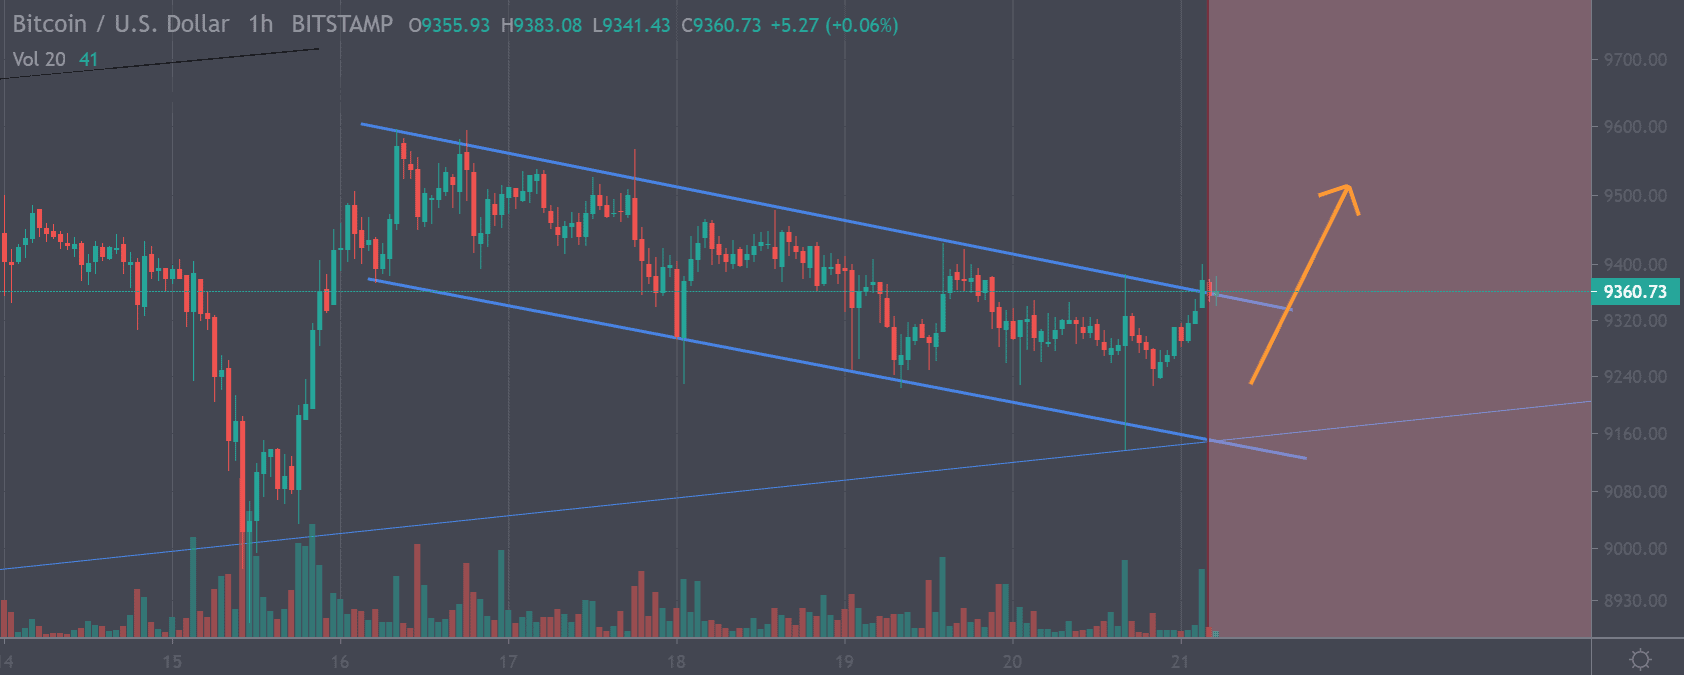
Bitcoin Price Chart by Trading View
The analyst has drawn a descending parallel channel in which BTC appears to be trading since the 16th of June. Kumar drew this pattern on the hourly price chart for the BTCUSD pair.
The crypto analyst believes that the cryptocurrency will see an uptrend if BTC price breaks above this channel. The analyst also stated that BTC is in a buy zone at the moment, and if BTC breaks above the upper boundary, it will become bullish.
Bitcoin: what’s next?
Bull Rider is another TradingView analyst who believes that the BTCUSD pair will see an uptrend ahead.
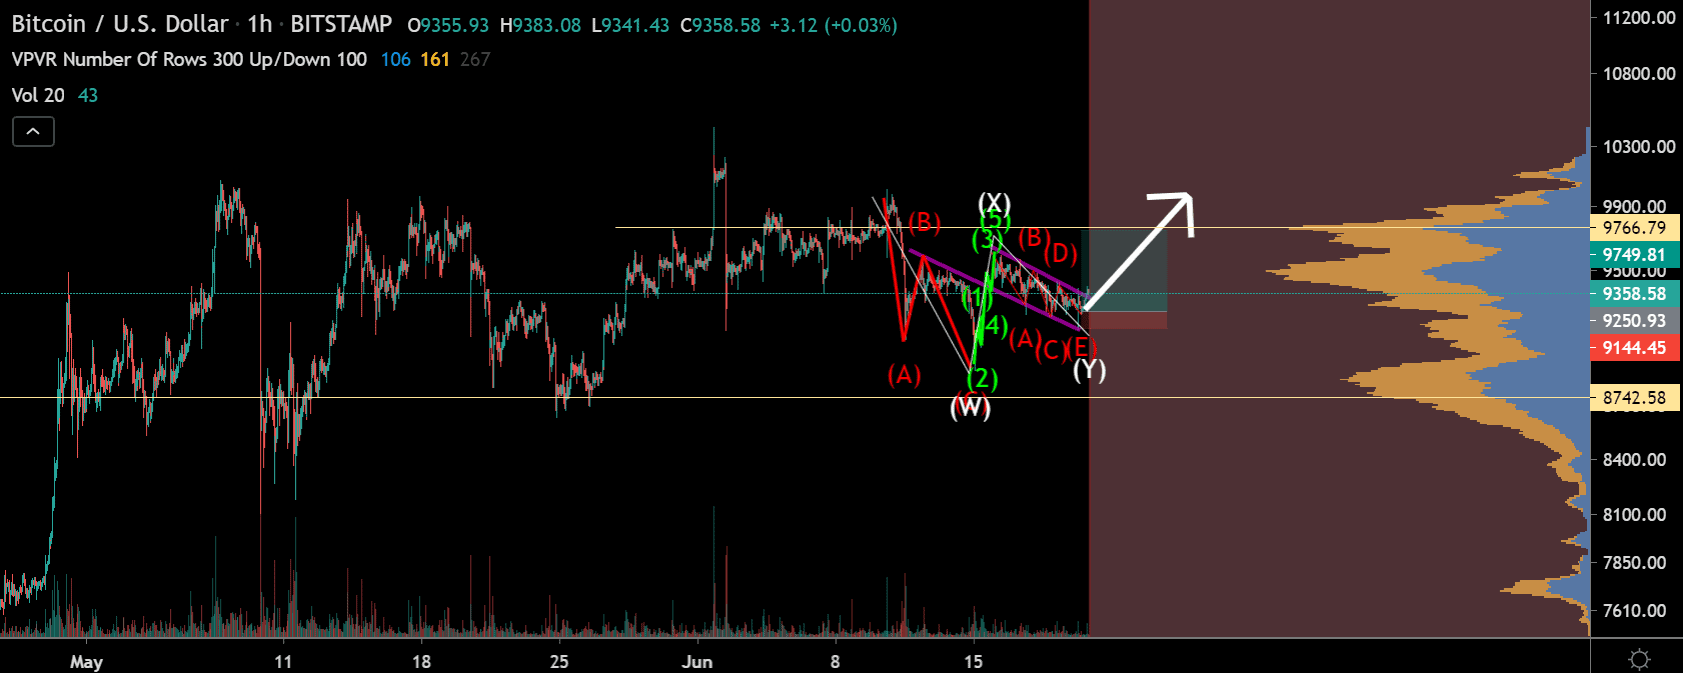
Bitcoin Price Chart by Trading View
The analyst discussed that BTC experienced a bullish rocket that touched the $10500 level, after which it immediately corrected the $9100 mark. The analyst suggested that this move is bearish, which is called the false breakout sign. This is because the bulls failed to hold BTC price up, and Bitcoin has only observed seen a variation of a few hundred dollars at a time.
The cryptocurrency touched the $9100 support on the 19th of June, which acted as the support for the last ten days. A bullish candle can be observed with a strong opening wick, and if we view the daily chart above, this pattern is the falling three candlestick pattern. The pattern described by the analyst is a bullish pattern, which is why the analyst believes that BTC will see a rise towards $9450 to $9750. First, a test of $9450 is expected, and if it breaks, then BTC price is expected to test $9750.
Disclaimer: The information provided is not trading advice but an informative analysis of the price movement. Cryptopolitan.com holds no liability towards any investments based on the information provided on this page.
4y ago
bullish:
9
bearish:
3
Share

 Manage all your crypto, NFT and DeFi from one place
Securely connect the portfolio you’re using to start.

bullish:
0
bearish:
0

bullish:
0
bearish:
0

bullish:
0
bearish:
0

bullish:
0
bearish:
0