Coins to Watch Price Analysis - Zilliqa, Loki and WaltonChain
4y ago
bullish:
4
bearish:
2
Share
The first October full week is upon us. Bitcoin is holding strong above a 6-month-old rising trend line after all the turbulence seen last week. Three major bearish drivers should have pushed the market beneath the trend line, however, the bulls held strong and resisted any major drops. If you are interested, the three bearish driving forces were; KuCoin Hack, BitMex charged by CFTC and DOJ, and President Donald Trump contracting COVID-19.
Yesterday, we released an article overviewing the top 3 coins for you to watch this week. On the list are ZIL, LOKI, and WTC. Following is some technical analysis for these altcoins to discuss some areas of support and resistance moving forward.
Zilliqa Price Analysis
What has been going on?
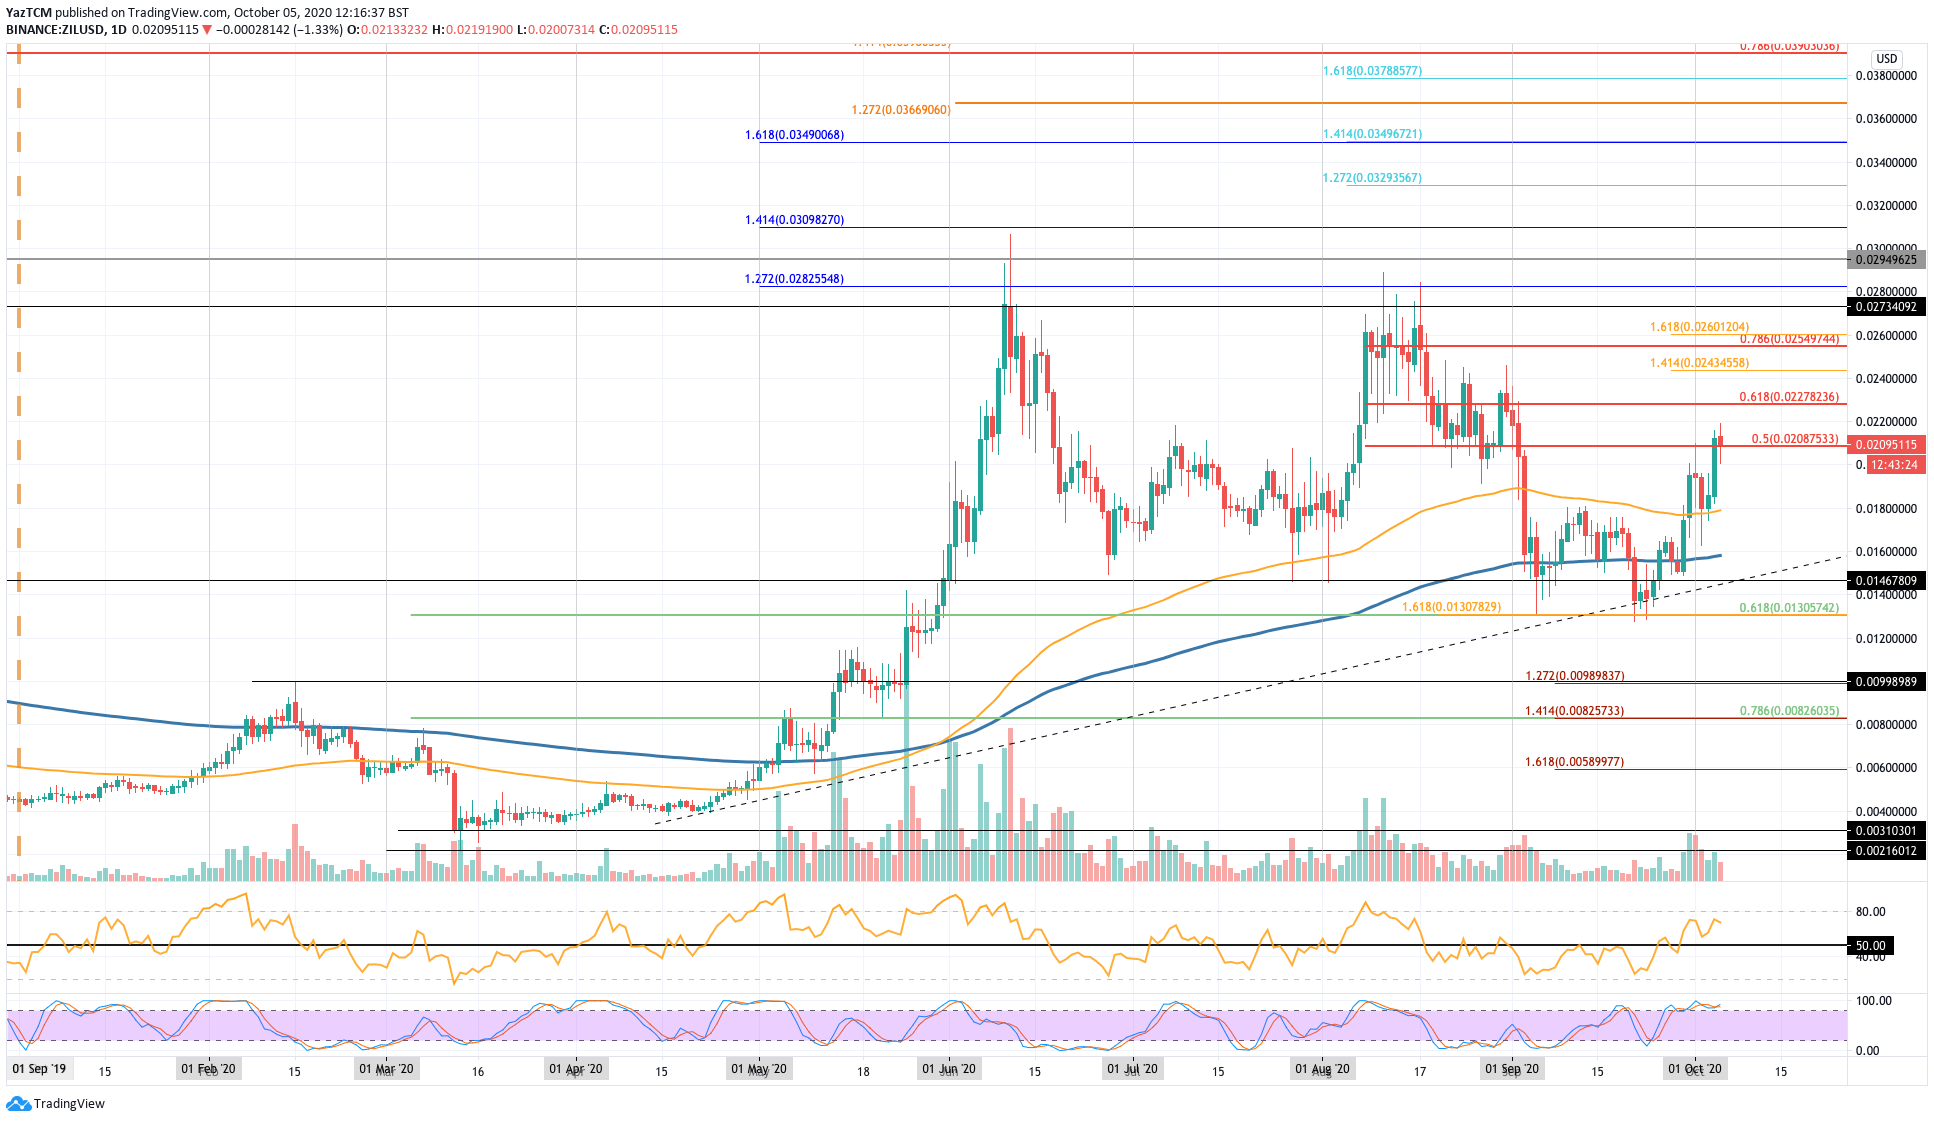
ZIL has seen a strong 30% price increase over the last week of trading after it rebounded from the support at the $0.013 level. The support here was provided by a .618 Fib Retracement and was further bolstered by a downside 1.618 Fib Extension.
Like all cryptocurrencies, ZIL had dropped lower in September as it fell from $0.024 to reach the aforementioned support at $0.013. From there, it rebounded higher to break back above the 200-day and 100-day EMA’s to reach as high as $0.0209 today.
We can see that the coin recently broke above a short term bearish .5 Fib Retreacemetn at $0.0208 as it starts to head back to the 2020 high-day close resistance at around $0.0273.
ZIL price short term prediction: Neutral
ZIL would have to be considered as neutral until it can break above the September highs at around $0.024 - at which point, it would be considered as bullish in the short term. It would need to drop beneath the support at $0.013 before it could be considered as bearish.
If the sellers do push lower again, the first level of support lies at $0.02. Beneath this, support lies at $0.018 (100-day EMA), $0.016 (200-day EMA), and $0.01467 (rising trend line support). Added support then lies at $0.013 (.618 Fib), $0.012, and $0.01.
Where is the resistance toward the upside?
On the other side, the first level of resistance above lies at $0.022. This is followed by added resistance at $0.0227 (bearish .618 Fib), $0.0243 (1.414 Fib extension), and $0.0255 (bearish .786 Fib Retracement).
If the bulls continue to drive higher, resistance lies at $0.0273 (2020 high-day closing price), $0.028, and $0.03.
Loki Price Analysis
What has been going on?
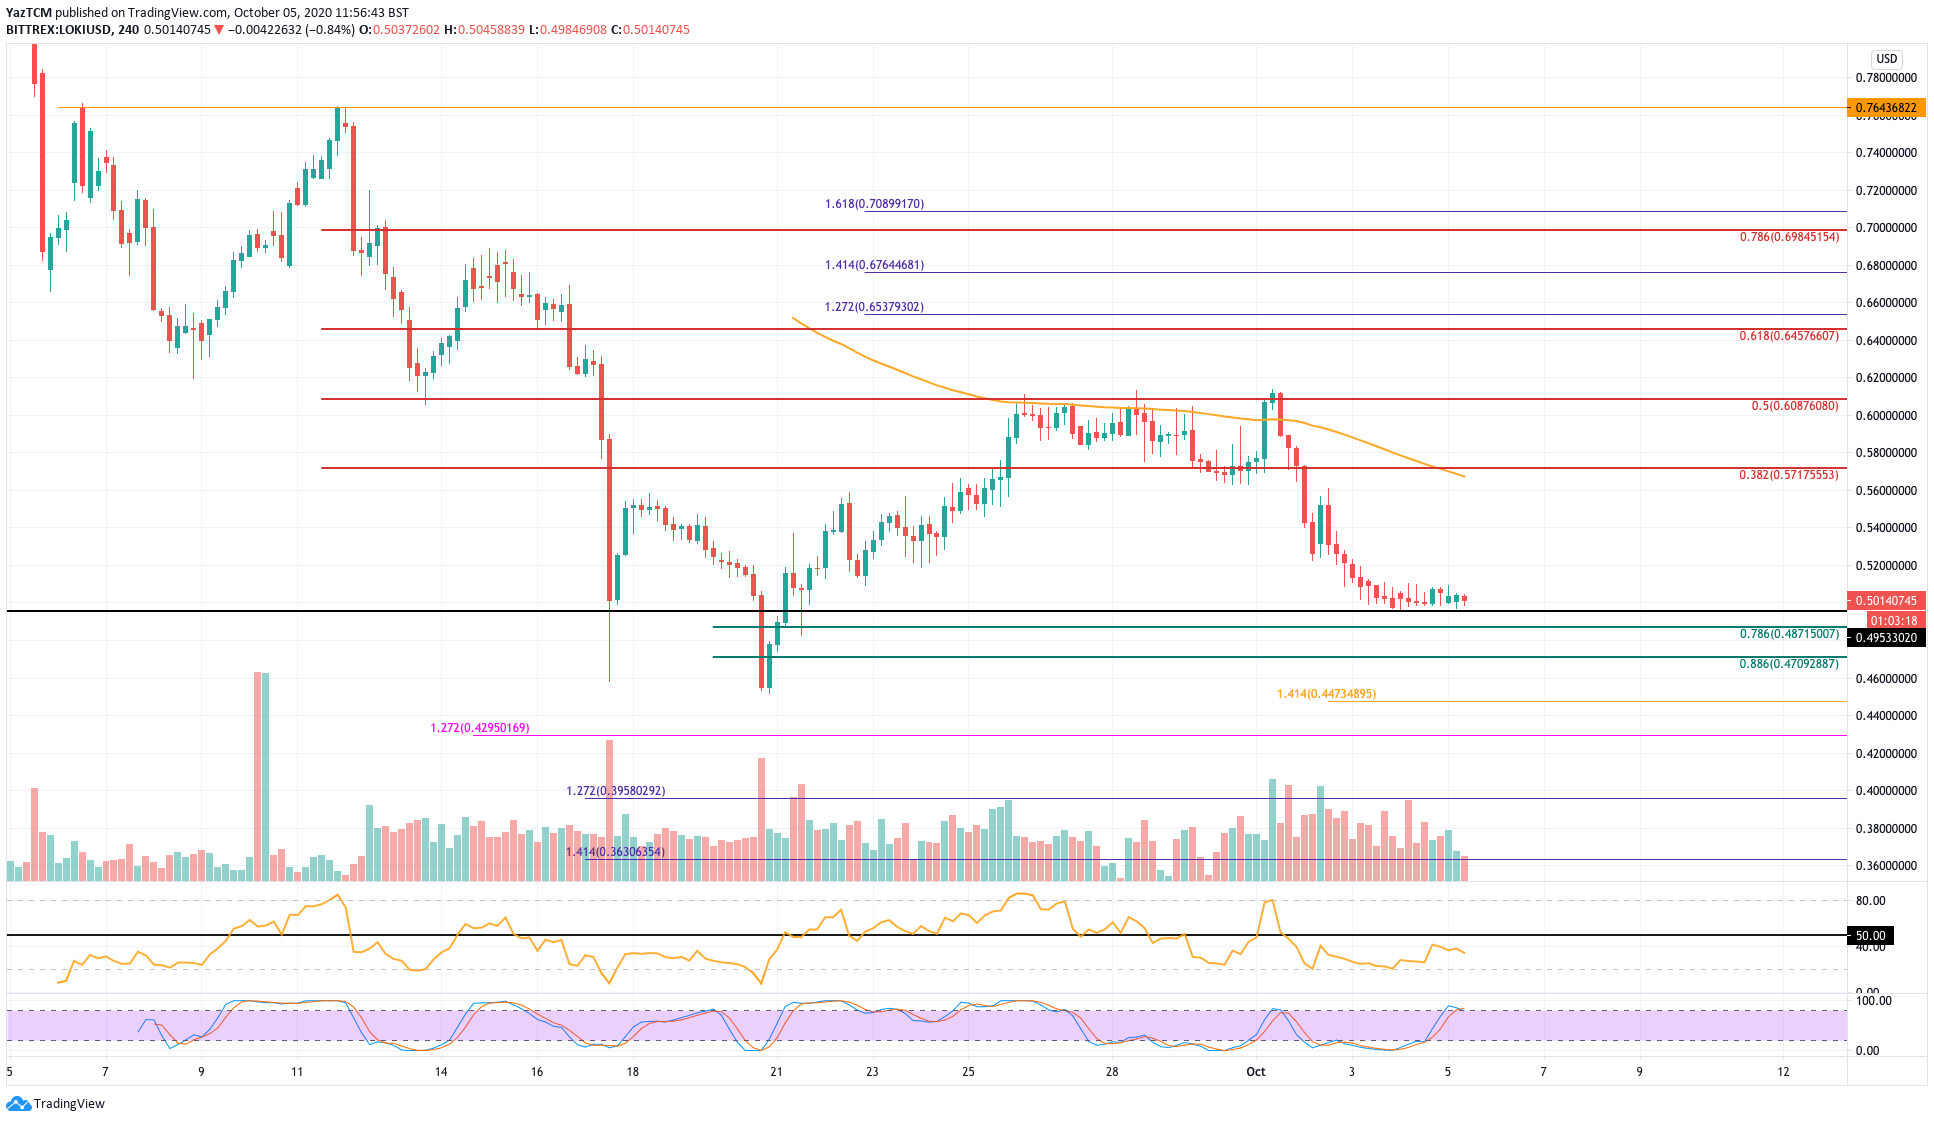
LOKI hit the markets in early September and has been in a constant state of decline ever since. It reached as low as $0.46 in the last week of September which allowed the coin to rebound. After bouncing, LOKI started to push higher until it found resistance at a $0.608 which is provided by a bearish .5 Fib Retracement level.
The buyers attempted to break this resistance in October but failed to do so, and, as a result, they rolled over and started to head lower again. The market found support at $0.495 this weekend and has been holding here ever since.
LOKI price short term prediction: Neutral
LOKI is neutral but a break beneath $0.46 would turn the market bearish again. The coin would have to make ground above the resistance at $0.608 before we can start to consider a bullish market.
If the sellers do push beneath the $0.495 level, support is first located at $0.387 (.786 Fib). This is followed by support at $0.47 (.886 Fib), $0.46, and $0.447 (downside 1.414 Fib Extension). Additional support then lies at $0.429, $0.4, and $0.395.
Where is the resistance toward the upside?
On the other side, the first level of resistance is expected at $0.52. Above this, resistance lies at $0.55, $0.571 (bearish .382 Fib), and $0.608 (bearish .5 Fib). Additional resistance then lies at $0.645 (bearish .618 Fib), $0.653 (1.272 Fib Extension), $0.676 (1.414 Fib Extension), and $0.698 (bearish .786 Fib).
WaltonChain Price Analysis
What has been going on?
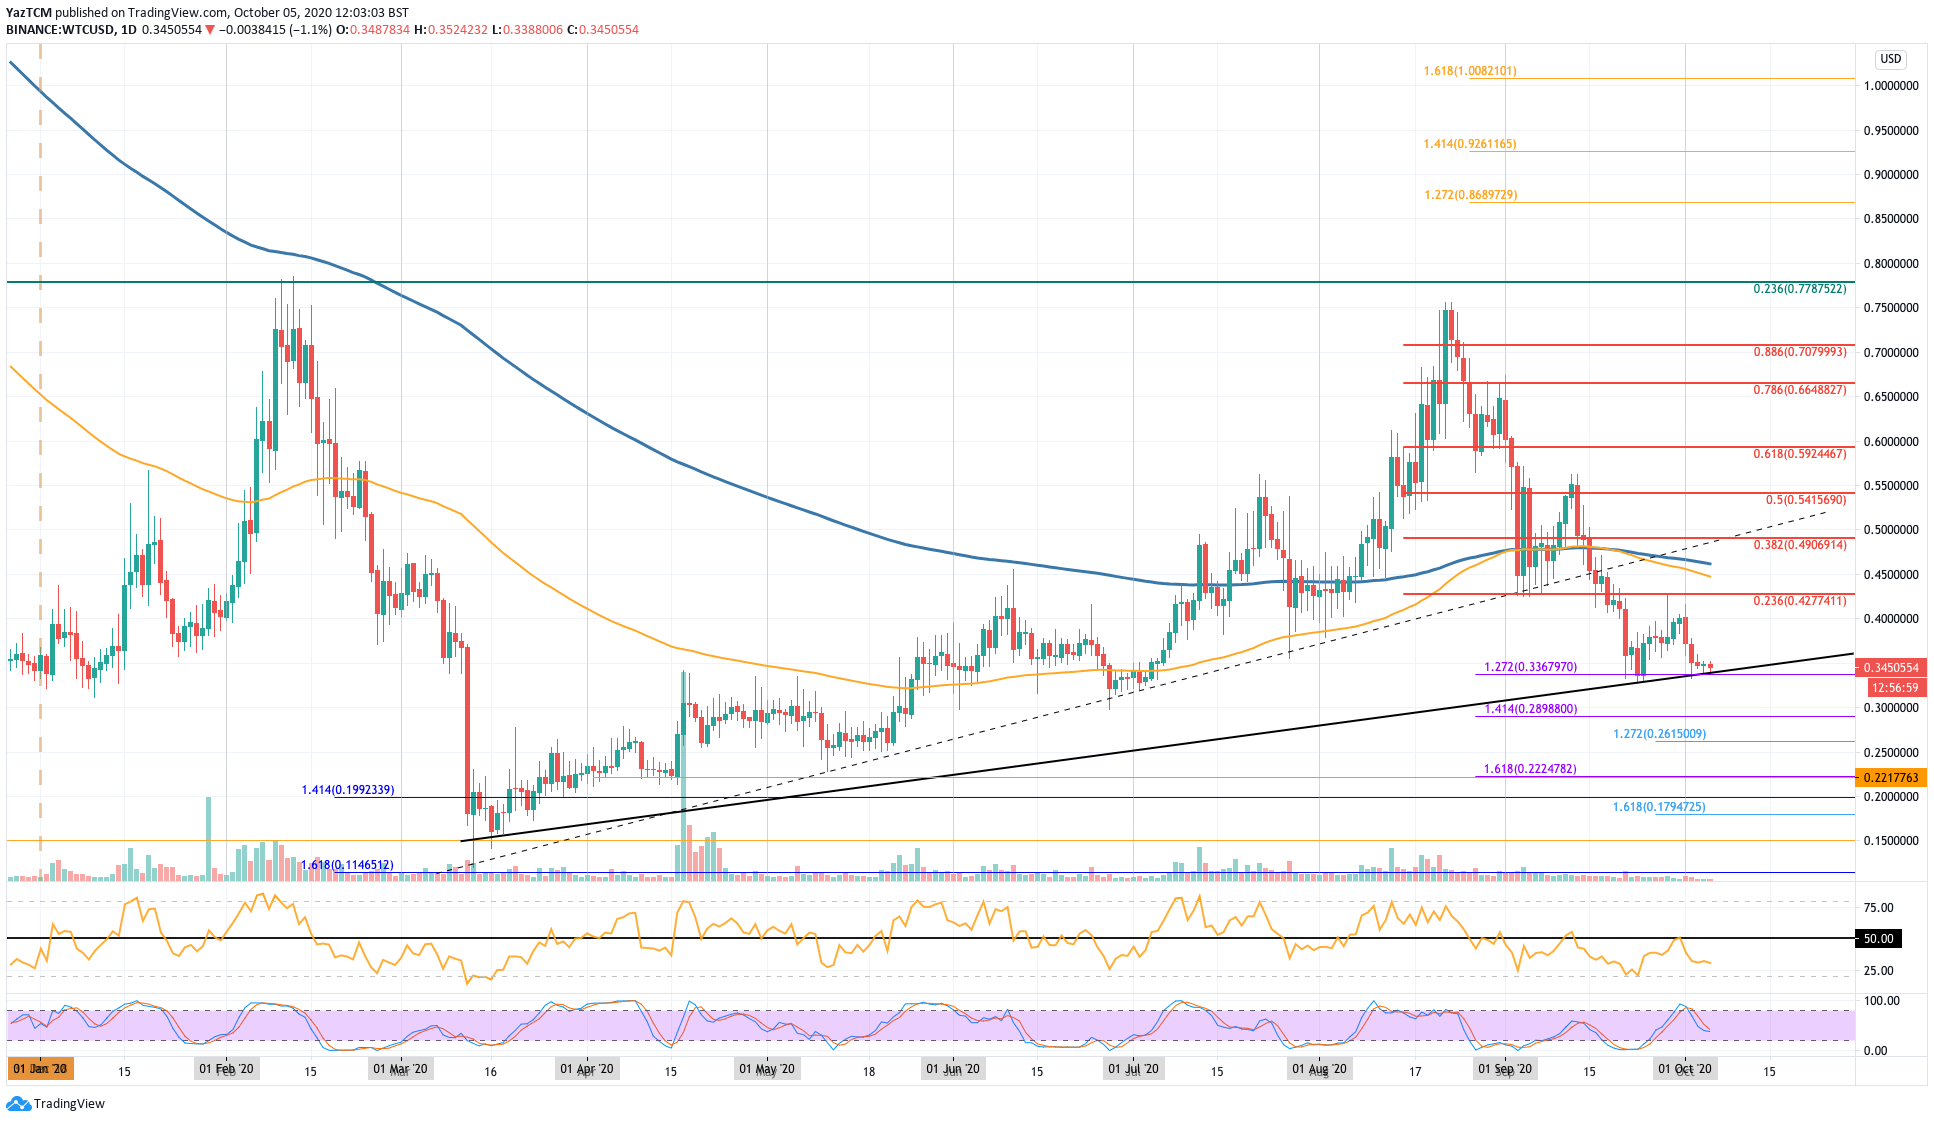
Waltonchain saw a strong 11.5% price fall over the past week and a stronger 35% price drop over the past month. The cryptocurrency had dropped as low as $0.15 during the March COVID-caused-collapse.
It rebounded from this support and was slowly grinding higher throughout the rest of the year, In August, WTC had surged higher to reach the resistance at $0.75 but it rolled over from here and headed lower.
In September, WTC dropped from $0.65 to initially reach the support at $0.45 - provided by a long term rising support trend line. Unfortunately, as September progressed, WTC went on to drop beneath this rising trend line and dropped lower into the support at $0.336 (downside 1.272 Fib extension).
The coin attempted to rebound at the end of September but it was cut short by resistance at $0.427 (bearish .236 Fib Retracement). The coin has since dropped back to the support at $0.336.
WTC price short term prediction: Neutral
WTC can be considered neutral right now, however, a break beneath $0.33 would turn the market bearish in the short term. It would have to rise above the $0.55 level before we can start to bullish in the short term.
If the sellers do break beneath $0.33, the first level of support lies at $0.3. This is closely followed by support at $0.289 (downside 1.414 Fib Extension), $0.261 (downside 1.272 Fib Extension - blue), and $0.222 (downside 1.618 Fib Extension).
Added support then lies at $0.2.
Where is the resistance toward the upside?
On the other side, the first level of resistance lies at $0.4. Above this, resistance is found at $0.427 (bearish .236 Fib), $0.45 (200-day EMA), and $0.49 (beraish .382 Fib). Above $0.5, additional resistance lies at $0.54 (bearish .5 Fib), $0.59 (bearish .618 Fib), and $0.65.
4y ago
bullish:
4
bearish:
2
Share


 Manage all your crypto, NFT and DeFi from one place
Securely connect the portfolio you’re using to start.

bullish:
0
bearish:
0

bullish:
0
bearish:
0

bullish:
1
bearish:
0

bullish:
2
bearish:
1