Analyst: this “textbook pattern” says there’s a 72% likelihood Bitcoin will burst past $10,000
4y ago•

bullish:
0
bearish:
0
Share
As random as Bitcoin’s price action seems, it’s often textbook. The price action is so textbook, in fact, that two run-of-the-mill technical analysis patterns suggest that the cryptocurrency is about to rally even higher than it already has over the past week.
Bitcoin is about to rally even higher, two textbook patterns predict
Cryptocurrency analyst “Nunya Bizniz” recently noted that since the $14,000 top, Bitcoin has formed an eerily accurate descending broadening wedge, a pattern first defined by legendary chartist Thomas Bulwolski.
The wedge is defined by months of falling prices and increasingly-wider moves that eventually resolve to the upside, at least on 72 percent of occasions the pattern is spotted.
This means that if Bulwolski’s studies are accurate, Bitcoin has a high chance of continuing to rally higher towards $14,000, the target breakout of the wedge.
BTC Weekly: Descending Broadening Wedge
Please see notes on chart – they are Bulkowski.
A rise to the top of the wedge would be +40%
A breakout to target would be +100%
Hopium? pic.twitter.com/aqR12Ed0ai
— Nunya Bizniz (@Pladizow) March 25, 2020
It isn’t only this pattern that suggests Bitcoin will soon reverse the entirety of the Mar. 12 capitulation.
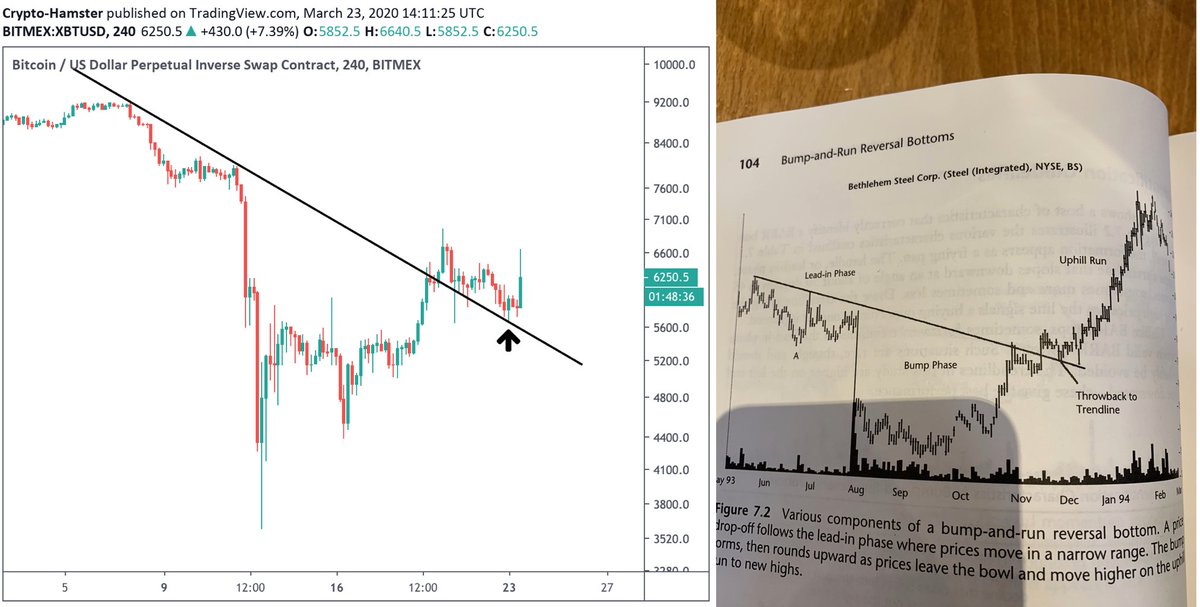
As written about in a previous CryptoSlate market update, Bitcoin’s price action over the past few weeks has been tracing the textbook schematic of the “bump-and-run reversal (BARR) bottom,” which is marked by a downtrend into a capitulation sell-off, a short bout of accumulation, then a surge out of that accumulation.
Bitcoin completing the pattern to a T will see it rally past the highs at $9,000 in the coming weeks, potentially by the end of the month.
All eyes on $8,000
While these two textbook patterns suggest that Bitcoin rallying to $10,000 and beyond will be easy, that is far from the truth.
Filb Filb — the pseudonymous cryptocurrency trader that predicted all of Bitcoin’s price action in Q4 2019 and January 2020 — recently wrote in an analysis that at $8,000, there’s the “worst cluster of resistance seen since the bear market of 2018.”
Indeed, his chart indicates that at this level, there exists a strong confluence of technical levels that will act as resistance if Bitcoin attempts a run at them:
- The 200-day moving average.
- The 100-day moving average.
- The 50-day moving average.
- The 20-month moving average.
- Bitcoin’s 61.8% Fibonacci Retracement of the February high to the $3,800 bottom.
- And the yearly pivot level.
The fact that all these levels are currently situated at $8,000 suggests it won’t be easy for buyers to break through that level in one go. As Filb Filb wrote:
“Therefore any long side positioning at $7k is likely to run into possibly the worst cluster of resistance seen since the bear market of 2018 and caution must be taken to account for this should Bitcoin break $6.8-7k; the prize is 15% of upside but I’m expecting the hammer to fall, […] a return to $7k is likely to occur.”
The post Analyst: this “textbook pattern” says there’s a 72% likelihood Bitcoin will burst past $10,000 appeared first on CryptoSlate.
4y ago•
bullish:
0
bearish:
0
Share

 Manage all your crypto, NFT and DeFi from one place
Securely connect the portfolio you’re using to start.

bullish:
0
bearish:
0

bullish:
0
bearish:
0

bullish:
0
bearish:
0

bullish:
0
bearish:
0