Binance Coin price moves past $15.6
4y ago
bullish:
1
bearish:
0
Share

On the 4th of July, the Binance Coin price line turned bullish and moved past the $15.60 mark while following the market it was also unable to maintain the high position and fell back to almost the same level as at the start of the day. The cryptocurrency was observed trading within a range of $15.25 to $15.64.
1-Day Binance Coin price analysis (4th July)
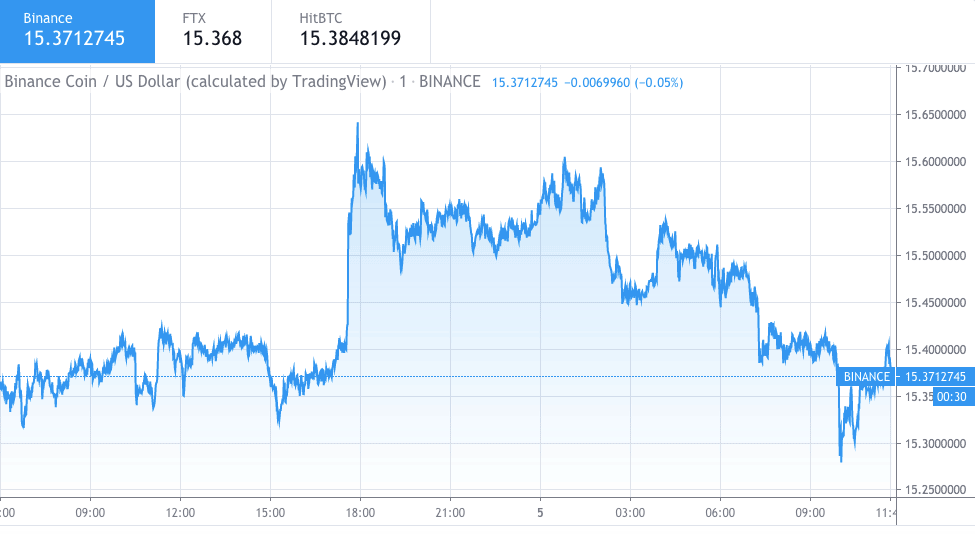
Binance Coin price chart by Trading View
At the beginning of the 4th of July, Binance Coin traded at the $15.25 mark. After a few minor ups and downs in the cryptocurrency’s price, the BNB price graph showed ruffled movements between the $15.30 and $15.45 marks until after 17:30 GMT, when the coin soared up the price graphs and reached past the $15.60 mark.
The BNBUSD pair reached a day’s high of $15.64 US Dollars, after which it traded between the $15.45 and $15.65 levels until the end of the day’s trade in GMT time. However, following that the price fell with the market, and at the time of writing, BNB was priced at $15.371 US Dollars.
Binance Coin price bull run on technical indicators
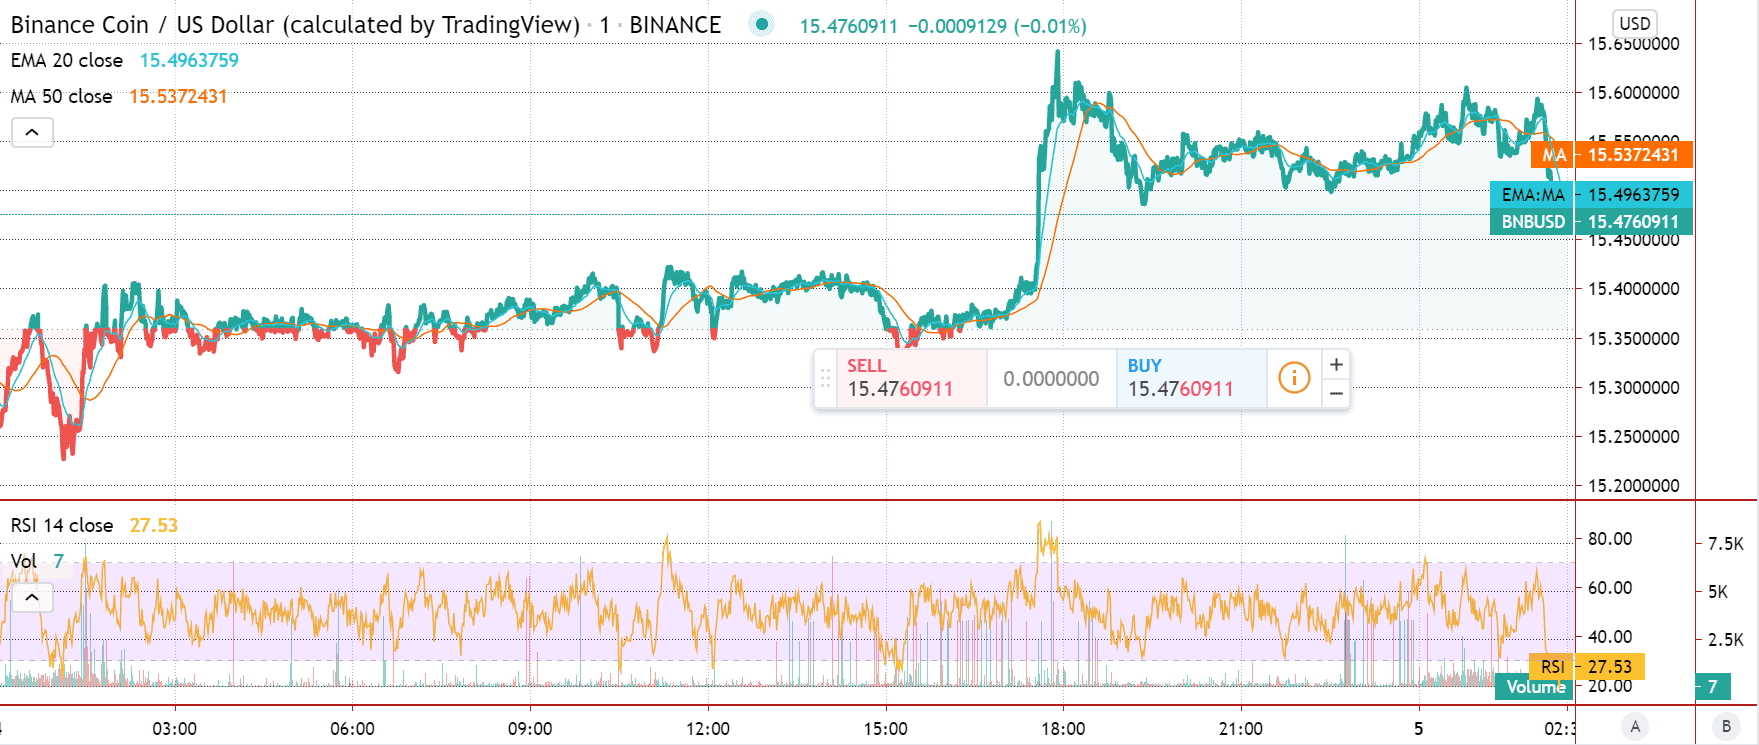
Binance Coin price chart by Trading View
The moving averages kept their movements below the $15.45 mark until Binance Coin turned bullish near 18:00 GMT, after which the price shot across the $15.60 level and the technical indicators followed. The 20-Day Exponential Moving Average (20EMA) was observed closing at the $15.49 mark, while the 50-Day Moving Average (50MA) closed the day’s trade at $15.53.
The Relative Strength Index (RSI) was observed at multiple highs across the 80.00 mark. The indicator reached 81.62 at 11:20 GMT and 87.76 at17:35 GMT, which shows that Binance Coin was overbought at the instances. For the day’s lowest, the technical indicator reached a day’s low of 21.70, which means that the cryptocurrency was oversold at that time. For the day’s closure, the RSI indicator was observed at 27.53.
Disclaimer: The information provided is not trading advice but an informative analysis of the price movement. Cryptopolitan.com holds no liability towards any investments based on the information provided on this page.
4y ago
bullish:
1
bearish:
0
Share

 Manage all your crypto, NFT and DeFi from one place
Securely connect the portfolio you’re using to start.

bullish:
9
bearish:
0