Cardano, Terra Price Analysis: August 3, 2021
3y ago
bullish:
13
bearish:
5
Share

- Cardano price begins trimming gains after failing to close the gap to $1.4.
- Terra price lifts by more than 20% to trade at $15.
Cryptocurrencies across the board are grappling with intensifying overhead pressure. The gains-trimming exercise has been going on for a few days now. For instance, Bitcoin can barely hold above $38,000, although it exchanged hands at $42,500 on Sunday. Ethereum price is down 1.9% to trade at $2,500 while Ripple corrected from highs of $0.78 to the prevailing $0.71.
Cardano:
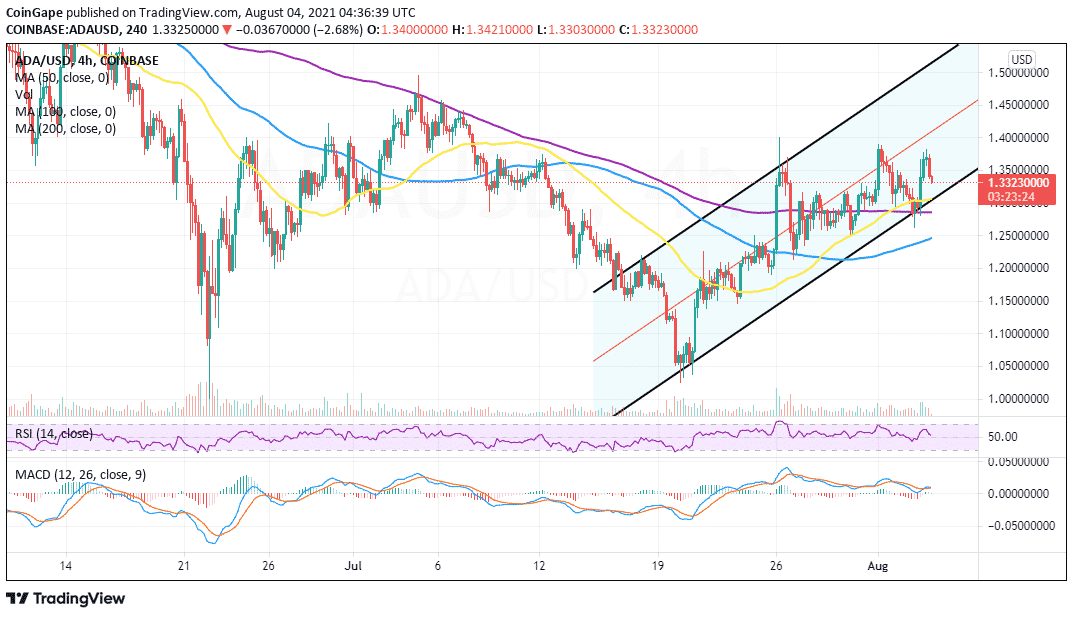
Cardano’s recovery from levels of around $1.05 aimed to close July above $1.4. However, the uptrend became increasingly challenging, especially after breaking above the ascending channel’s middle boundary.
At the time of writing, bears seem to be focused on slashing the gains accrued over the last 24 hours. Besides, ADA has lost tentative support at $1.35. As the correction proceeds, support is expected to come in handy at the 50 Simple Moving Average (SMA) on the four-hour chart near $1.3. The channel’s lower edge has reinforced the same buyer concentration zone.
It is essential to realize that the Relative Strength Index (RSI) adds credibility to the bearish dominance. The RSI holds at the midline but after dropping from levels close to the overbought area. If it retreats to the oversold territory, we expect Cardano to close the week below $1.3 and perhaps retest support at $1.25.
ADA/USD four-hour chart
Terra:-
Terra has broken off from other altcoins to post remarkable gains mid-week, although the rest of the market is dealing with mounting overhead pressure. Data by CoinGecko shows that Luna has rallied over 20% in less than 24 hours to trade at $15.
However, a correction seems to be underway mainly due to overbought conditions, as highlighted by the Relative Strength Index (RSI). On the downside, support is anticipated at $12.5; here, bulls will regroup and plan to execute another mission toward $17.5.
LUNA/USD 12-hour chart

It is worth mentioning that the Moving Average Convergence Divergence (MACD) indicator has a bullish impulse which might help keep the uptrend intact in the short term. Besides, the odds for another run toward the all-time highs of $22.5 will increase if the 50 SMA crosses above the 200 SMA in the coming sessions.
The post Cardano, Terra Price Analysis: August 3, 2021 appeared first on Coingape.
3y ago
bullish:
13
bearish:
5
Share


 Manage all your crypto, NFT and DeFi from one place
Securely connect the portfolio you’re using to start.

bullish:
0
bearish:
0

bullish:
0
bearish:
0

bullish:
0
bearish:
0

bullish:
0
bearish:
0