Ethereum Price Analysis - ETH Continues To Straddle 100-day MA As Triangle Apex Draws Closer
3y ago
bullish:
0
bearish:
0
Share
Key highlights:
- Ethereum is down by a sharp 7% over the past week as it drops beneath $2,500 today.
- The cryptocurrency is currently battling to remain above the 100-day MA as it remains inside a symmetrical triangle pattern.
- Against Bitcoin itself, Ethereum is starting to show signs of struggling after rolling over from ₿0.077 this week and dropping to the current ₿0.066 level.
| Ethereum price | $2,472 |
|---|---|
| Key ETH resistance levels | $2,600, $2,700, $2,800, $2,890, $3,000 |
| Key ETH support levels | $$2,450, $2,400, $2,335, $2,200, $2,000 |
*Price at the time of writing
ETH is down by a sharp 7% this week as it continues to trade sideways within a consolidation pattern known as a symmetrical triangle. The cryptocurrency had tested the upper boundary of this triangle earlier in the week when it pushed to $2,800 but was unable to overcome the resistance.
Since then, ETH has rolled over and dropped beneath the $2,500 level today as it currently battles with the 100-day MA level. Nevertheless, it still remains inside the confines of the symmetrical triangle pattern.
With the consolidation continuing, it is no surprise that the sentiment for Ethereum is pretty negative. In fact, according to data from Santiment, the sentiment for ETH is currently at low levels that have not been properly seen since October 2020:
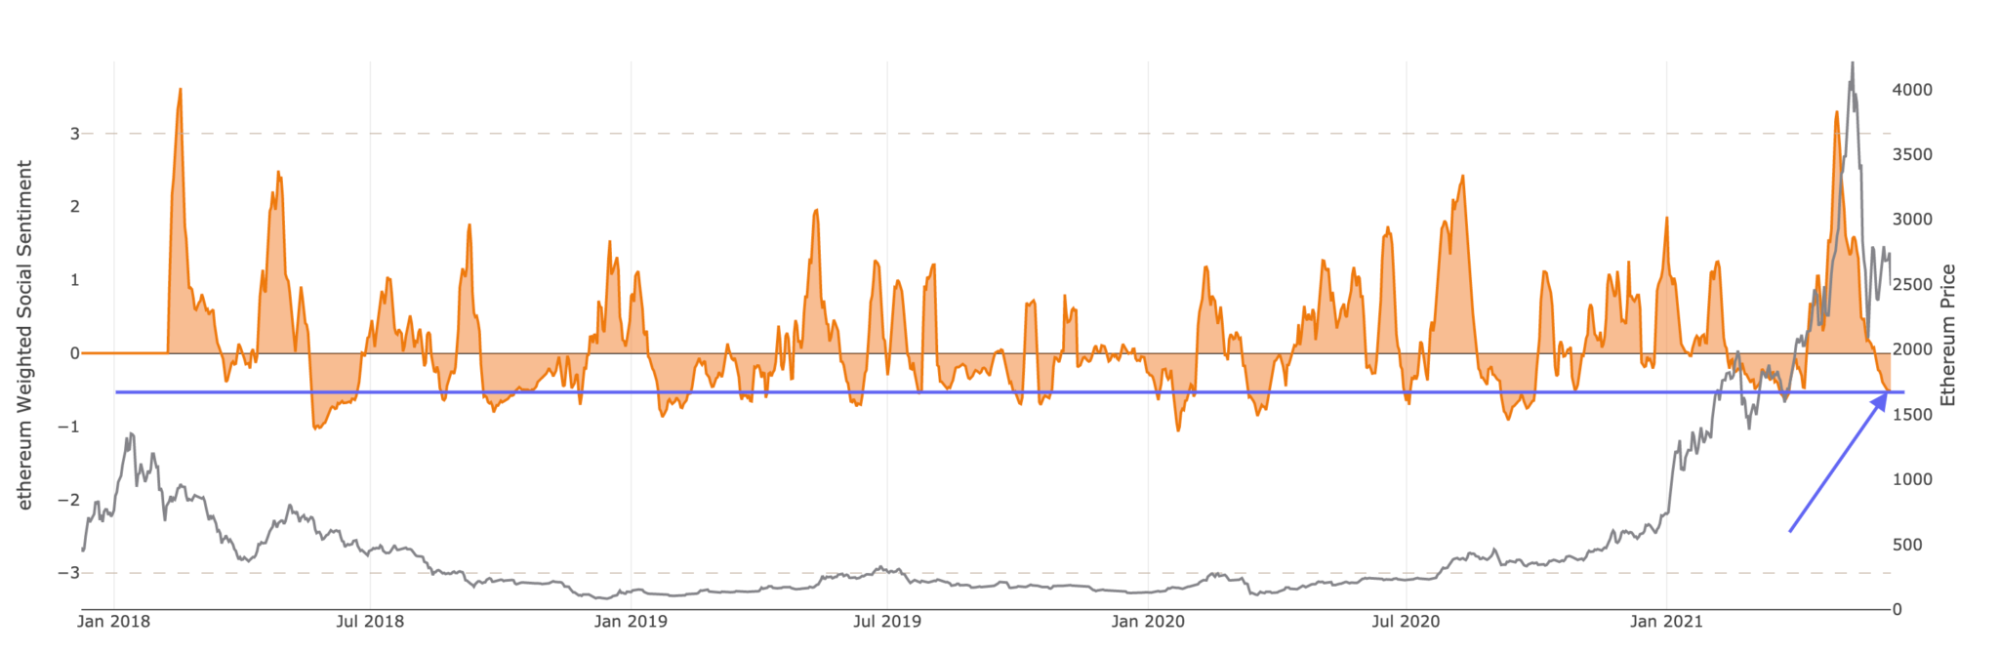
This shows that people are pretty negative toward the number two ranked cryptocurrency and are likely expecting it to continue lower before any reversal is seen. However, what is interesting to notice is that any time the sentiment index drops this low, the Ethereum price rebounds within a number of weeks. This could suggest that we might see a recovery by the end of June or, perhaps, in early July.
Despite the overwhelmingly negative sentiment, it seems that institutions might be beginning to pick up Ethereum at these prices. This week, over 395K worth of ETH flowed out of Coinbase. This is almost $1 billion worth of ETH leaving exchanges and is likely heading toward cold storage. Only institutions would have this sort of liquidity to be able to remove so much ETH from the exchange, and it can be considered as a strong bullish signal as it is removed from the market for selling.
Lastly, the Reddit founder, Alexis Ohanian, recently showed his support for Etheruem when the billionaire stated that he has “A lot” of Ethereum in an interview on CNBC.
Ethereum remains the 2nd largest cryptocurrency asset as it currently holds a $286 billion market cap value.
Let us continue to take a look at the markets and see where they might be heading.
Ethereum Price Analysis
What has been going on?
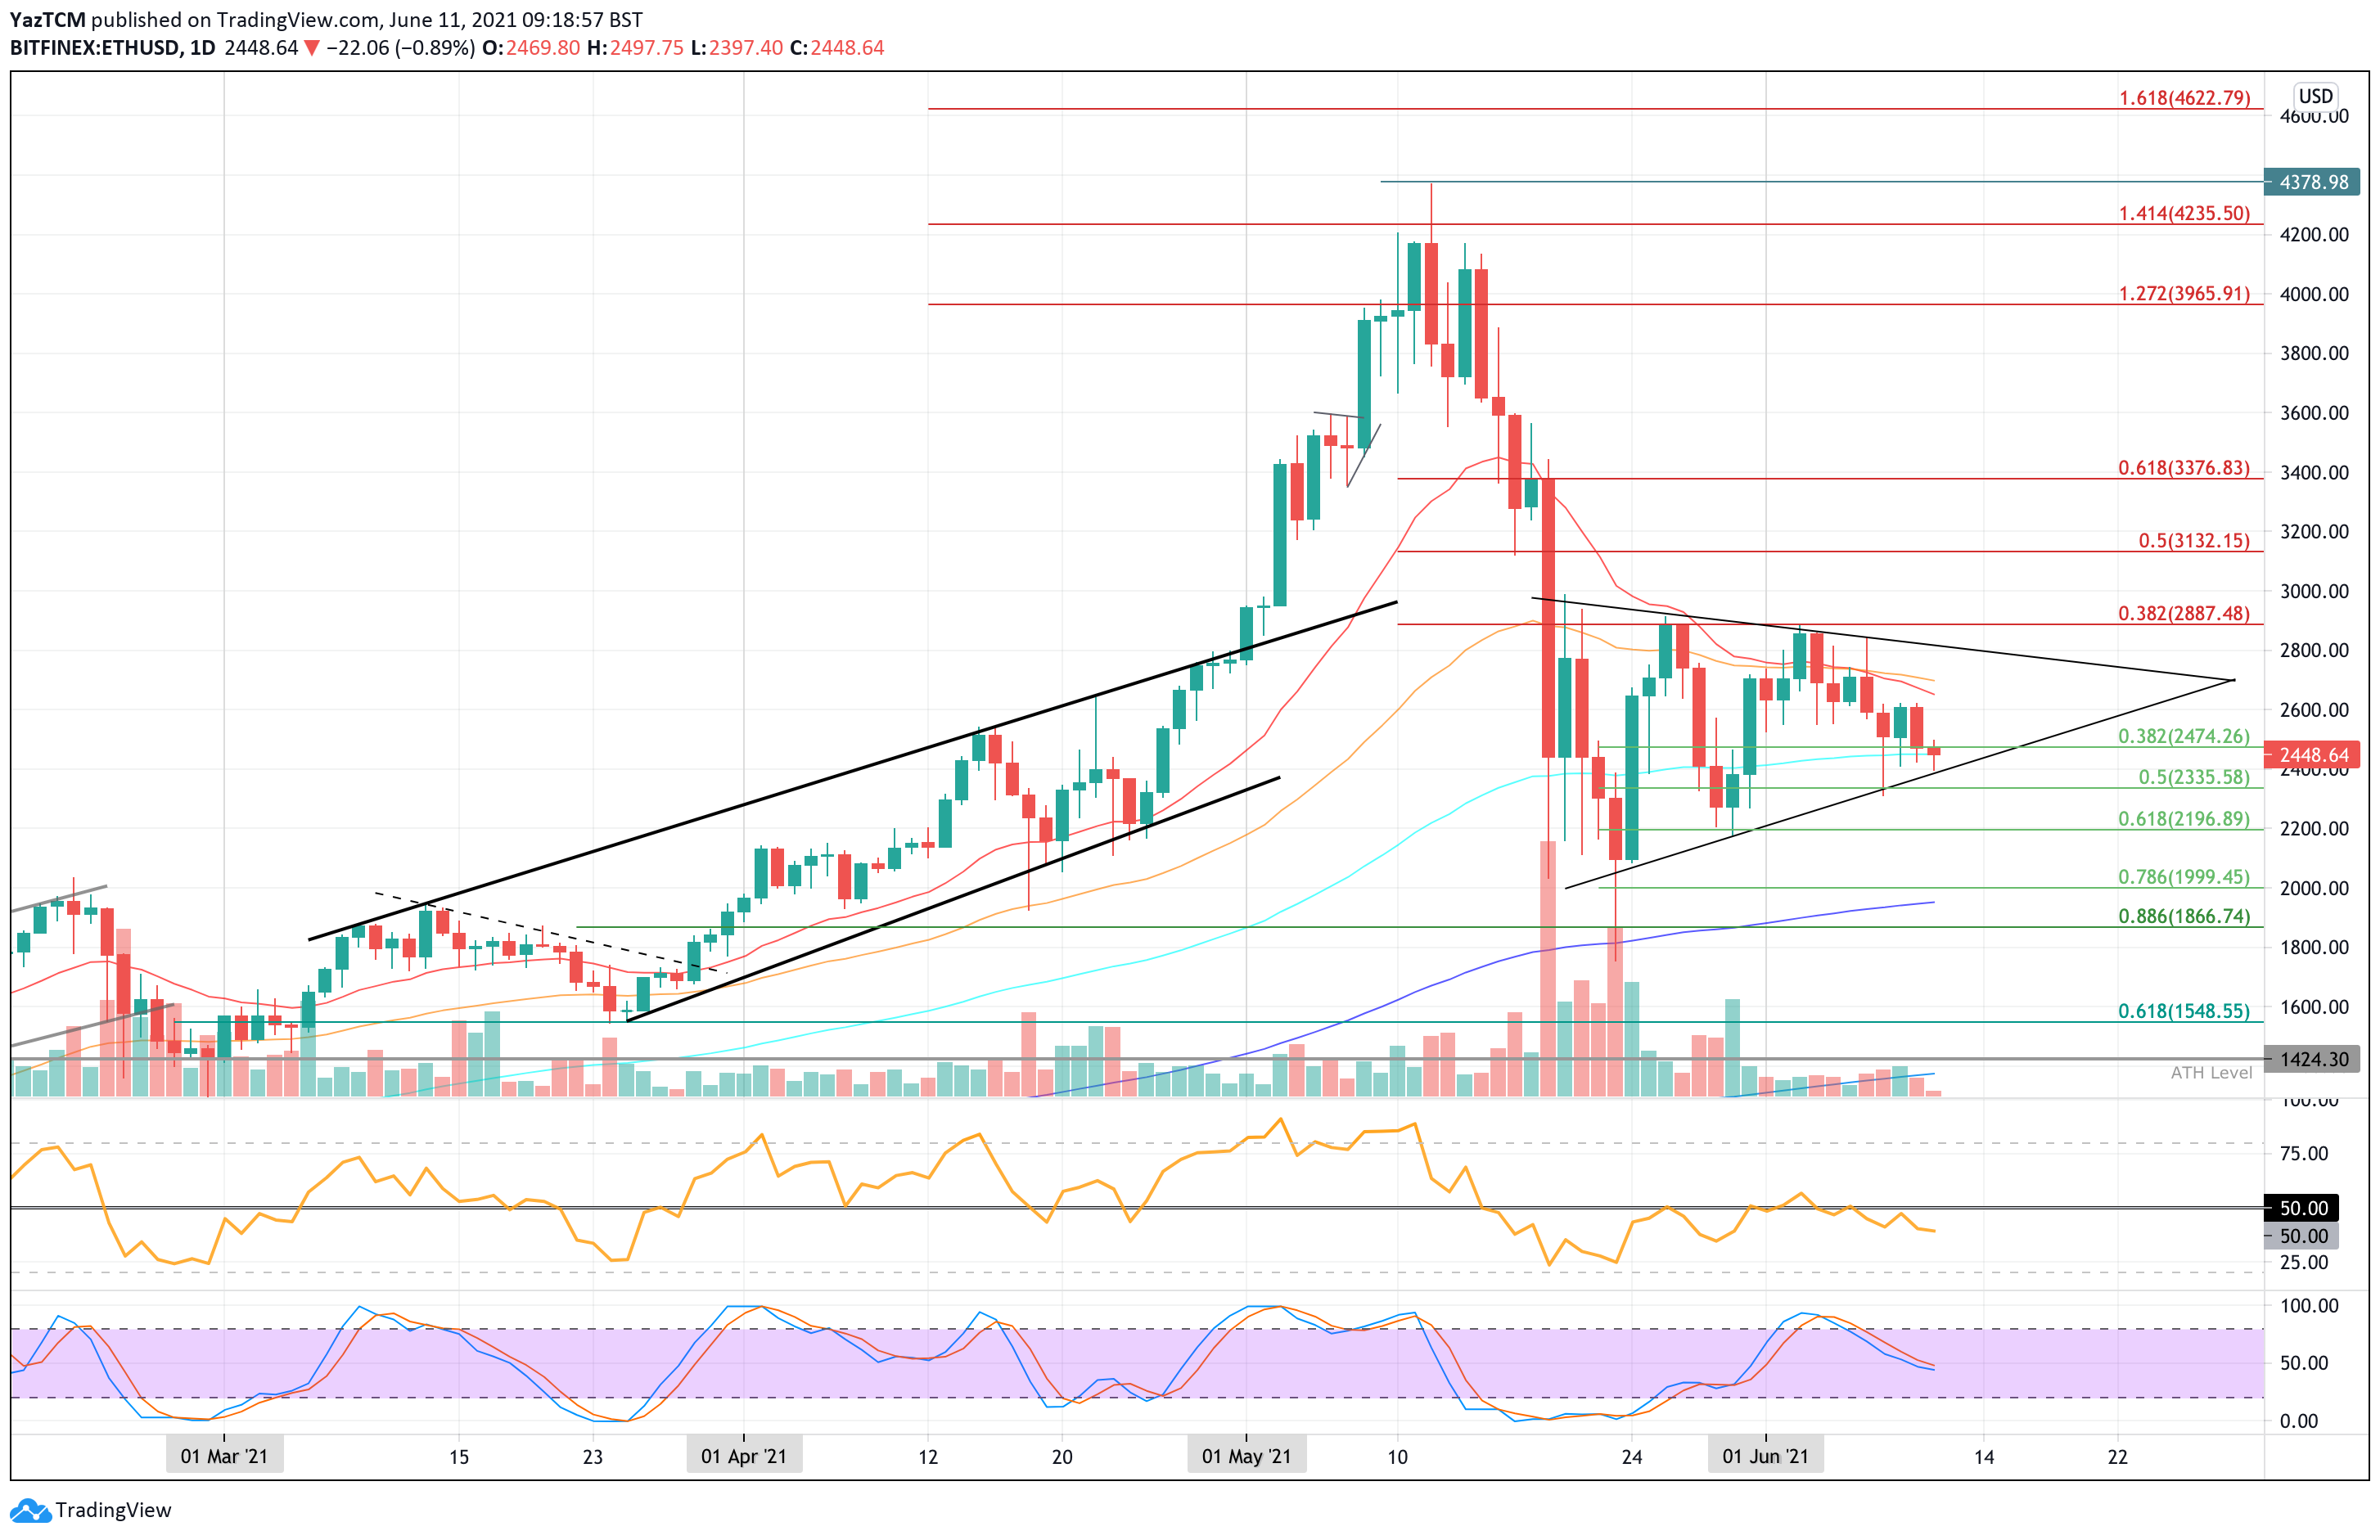
Taking a look at the daily chart above, we can clearly see the symmetrical triangle that Etheruem has been trading within over the past few weeks. It dropped from the upper boundary of this triangle earlier in the week and is now testing the support at $2,450, provided by the 100-day MA level.
The breakout direction of this symmetrical triangle is likely to dictate which way the market will head toward next.
Ethereum price short term prediction: Neutral
Etheruem has to be considered neutral right now. The coin would need to break back above $3,000 before we can start to consider a bullish market again. On the other side, it would still need to break beneath $2,000 (200-day EMA) before we can confirm a bearish market.
If the sellers push lower, the first support lies at $2,400 (lower angle of the triangle). This is followed by support at $2,335 (.5 Fib Retracement), $2,200 (.618 Fib Retracement), and $2,000 (200-day MA).
Where Is The Resistance Toward The Upside?
On the other side, the first level of resistance lies at $2,600. This is followed by $2,700 (50-day MA), $2,800 (upper angle of the triangle), and $2,887 (bearish .382 Fib Retracement * June highs).
Beyond the June highs, resistance lies at $3,000, $3,131 (bearish .5 Fib Retracement), $3,200, $3,376 (bearish .618 Fib Retracement), and $3,500.

What has been going on?
Etheruem has been struggling against Bitcoin this week after setting a new high for June at ₿0.077 (1.272 Fib Extension) earlier in the week. From there, it rolled over and started to head lower quite quickly as it broke beneath the 20-day MA level and hit the support at ₿0.0667 (.5 Fib Retracement) yesterday.
Today, the bears have continued to push ETH/BTC even lower as it currently sits at ₿0.0661.
Ethereum price short term prediction: Bullish
Ethereum is still considered bullish against Bitcoin in the short term. To turn neutral, it would need to fall beneath ₿0.0642 (50-day MA). It would have to fall further beneath the support around ₿0.055 (200-day EMA) to be in danger of turning bearish in the short term.
If the sellers push lower, the first support lies at ₿0.0642 (.618 Fib Retracement & 50-day MA). This is followed by support at ₿0.06, ₿0.0587 (long term .5 Fib Retracement), ₿0.055 (100-day MA), and ₿0.0531 (long term .618 Fib Retracement).
Where Is The Resistance Toward The Upside?
On the other side, the first level of resistance lies at ₿0.07 (20-day MA). This is followed by ₿0.0725, ₿0.075, and ₿0.077 (1.272 Fib Extension).
Beyond the June highs, additional resistance is expected at ₿0.08, ₿0.0824 (1.414 Fib Extension), ₿0.085, and ₿0.0892 (1.618 Fib Extension).
Keep up to date with the latest ETH price predictions here.
Previous ETH analysis
At CoinCodex, we regularly publish price analysis articles focused on the top cryptocurrencies. Here's 3 of our most recent articles about the price of Ethereum:
- Ethereum Price Analysis - ETH Remains Inside Triangle But Performing Well Against Bitcoin (Bullish)
- Ethereum Price Analysis - ETH Bulls Begin Recovery With 9% Rebound But Still Need To Overcome $2,895 (Bullish)
- Ethereum Price Analysis - ETH Rebounds From $2,000 Support To Meet Resistance at $2,800 - Can It Break Above? (Bullish)
3y ago
bullish:
0
bearish:
0
Share


 Manage all your crypto, NFT and DeFi from one place
Securely connect the portfolio you’re using to start.

bullish:
0
bearish:
0

bullish:
0
bearish:
0

bullish:
1
bearish:
0
