VeChain (VET) Price Prediction 2025–2030: Will VET Hit $0.02722 Soon?
0
0

- VeChain climbs within rising channel after early August rebound
- Clean break above July downtrend flips sentiment to bullish
- Bulls now eye $0.02696 and beyond as momentum builds
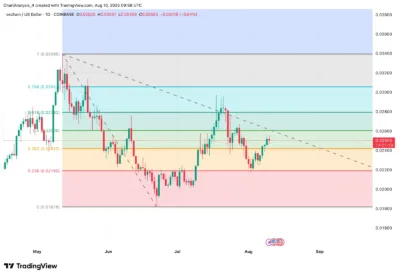
VeChain (VET) has rebounded sharply from early August lows near $0.02220, consolidating today at $0.02503 within a rising channel on the 4-hour chart. Price is holding above the channel midline at $0.02480, with the daily structure showing an advance from the 0.236 Fibonacci retracement at $0.02190 toward the 0.5 retracement at $0.02696.
The move above the descending trendline from late July adds structural confirmation to the bullish bias, while spot inflows of $577.41K highlight fresh accumulation interest. The next 24 hours will depend on whether price can break through the $0.02566 resistance and extend toward higher liquidity zones.

Source: Coinglass
Also Read: Wormhole (W) Price Prediction 2025–2030: Will W Hit $0.110 Soon?
Technical Indicators Support Bullish Outlook
On the daily chart, VET has reclaimed the $0.02420 Fibonacci 0.382 pivot and is pressing toward the $0.02696 Fibonacci 0.5 level. The bounce from $0.02190 has been reinforced by the break of the July downtrend line, giving buyers short-term control.

Source: Tradingview
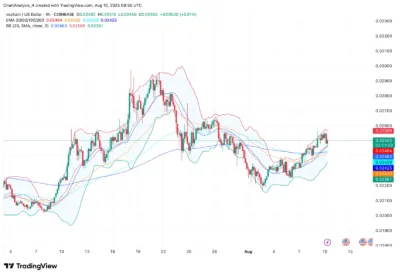
The 4-hour chart shows price moving within an ascending channel since August 1, with immediate support at the $0.02480 midline and deeper demand between $0.02350 and $0.02220. EMA alignment is bullish, with EMA20 at $0.02464 stacked above EMA50 at $0.02428, EMA100 at $0.02425, and EMA200 at $0.02420. This clustering strengthens the $0.02420–$0.02428 range as a defensive zone.
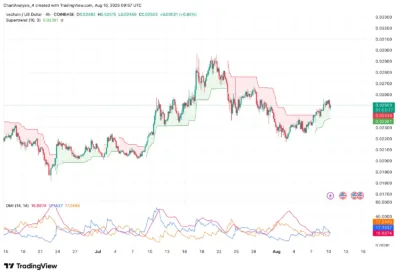
Bollinger Bands position the upper band at $0.02566 — the immediate breakout trigger. The 4-hour Supertrend remains bullish above $0.02381, matching the lower channel boundary for high-confluence support.

Source: Tradingview
The DMI shows +DI at 17.24 slightly above -DI at 17.14, while ADX at 16.88 signals that trend strength is still modest and will require volume expansion to accelerate. On the 30-minute chart, price sits just below VWAP at $0.02521. Liquidity is concentrated above at $0.02696–$0.02722, where Fibonacci resistance converges with July highs, and below at $0.02381–$0.02350 in recent demand zones.

Source: Tradingview
Resistance Test May Establish Trend of 2025
A decisive break and sustained close above $0.02566 would likely target $0.02696 as the initial upside objective, followed by $0.02722 where the 0.618 Fibonacci retracement aligns with historical resistance.
If VET fails to reclaim VWAP and slips below the $0.02480 channel midline, focus could shift to $0.02381. A close beneath this level would increase the risk of a move to $0.02350, and possibly a deeper slide toward $0.02220 — a breakdown that would compromise the current recovery structure.
VeChain Price Forecast 2025–2030
| Year | Minimum ($) | Average ($) | Maximum ($) |
| 2025 | 0.02220 | 0.02500 | 0.02722 |
| 2026 | 0.02350 | 0.02650 | 0.03000 |
| 2027 | 0.02480 | 0.02820 | 0.03450 |
| 2028 | 0.02550 | 0.03000 | 0.03800 |
| 2029 | 0.02690 | 0.03250 | 0.04100 |
| 2030 | 0.02800 | 0.03500 | 0.04500 |
Year-by-Year Outlook
2025
VET is in the early stages of a channel-based breakout, with primary support at $0.02420–$0.02480. Clearing $0.02566 with volume could open the path to $0.02696 and $0.02722 before year-end.
2026
If $0.02600 becomes a strong base, VET could average $0.02650 and rally toward $0.03000 on continued bullish structure.
2027–2028
Sustained higher lows above $0.02480 could lift VET toward $0.03450 in 2027 and $0.03800 in 2028, supported by broader market momentum and adoption trends.
2029–2030
If adoption continues and market cycles remain favorable, VET may test $0.04100 in 2029 and reach $0.04500 in 2030 under persistent accumulation.
Conclusion
VeChain’s climb from early August lows has been supported by a rising channel, bullish EMA alignment, and spot inflow strength. The $0.02566 resistance is now the key trigger level for upside expansion toward $0.02696–$0.02722.
Holding above $0.02480 keeps the bullish setup intact, while a close below $0.02381 would undermine short-term momentum. Traders should monitor VWAP positioning and volume at resistance for confirmation of the next move.
FAQs
1. Is VeChain going bullish?
Yes. The break of the July downtrend and bullish EMA alignment indicate a constructive short-term trend.
2. Where is the next significant resistance?
The $0.02566–$0.02722 zone is the main upside barrier.
3. Where is the best support?
Key supports are $0.02480, $0.02381, and $0.02350.
4. Will VeChain hit $0.02722 by year-end?
It’s possible if $0.02566 is broken with volume and structure holds above $0.02480.
5. What is behind VeChain’s rally?
Rising channel structure, break of July downtrend, bullish EMA stacking, Supertrend support, and spot inflows from accumulation.
Also Read: Aerodrome Finance (AFRO) Price Prediction 2025–2029: Can AFRO Hit $1.45 Soon?
The post VeChain (VET) Price Prediction 2025–2030: Will VET Hit $0.02722 Soon? appeared first on 36Crypto.
0
0
 Manage all your crypto, NFT and DeFi from one place
Securely connect the portfolio you’re using to start.


