Prices of BTC, ETH, and MATIC Tumble as DOGE Bulls Assume Charge
1y ago•

bullish:
6
bearish:
3
Share

- Bulls in Bitcoin, Ether, and MATIC tire as DOGE bulls continue to advance.
- Technical signs indicate that bears will continue to rule in BTC, ETH, and MATIC.
- Will DOGE bulls continue their upward trajectory in the face of a market crisis?
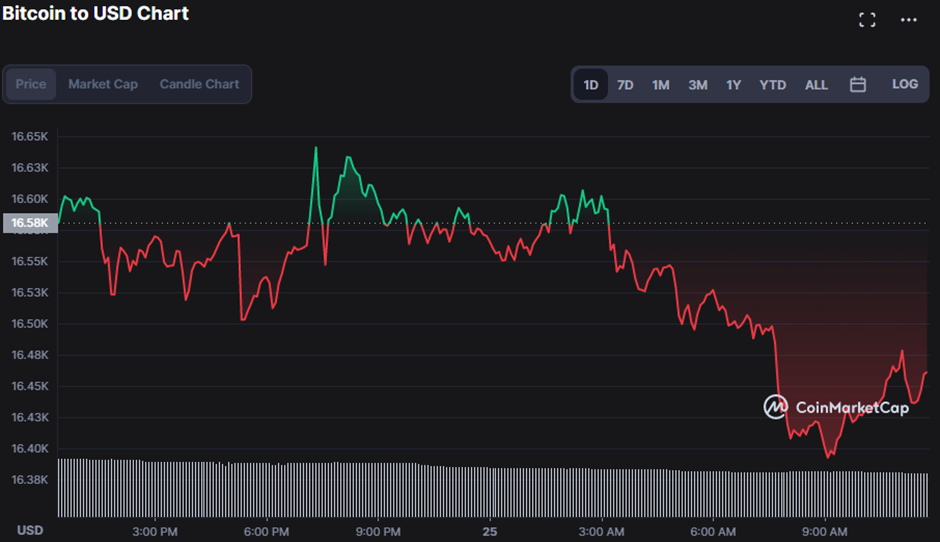
Over the past day, Bitcoin (BTC) has been trending downward with brief bursts of bullish dominance. The BTC bears were able to lower prices during this decline by 0.76%, valuing the crypto at $16,474.09 as of press time.
BTC’s market capitalization and 24-hour trading volume plummeted during the slump by 0.71% and 25.99%, respectively, to $316,501,119,879 and $23,489,942,049, respectively.
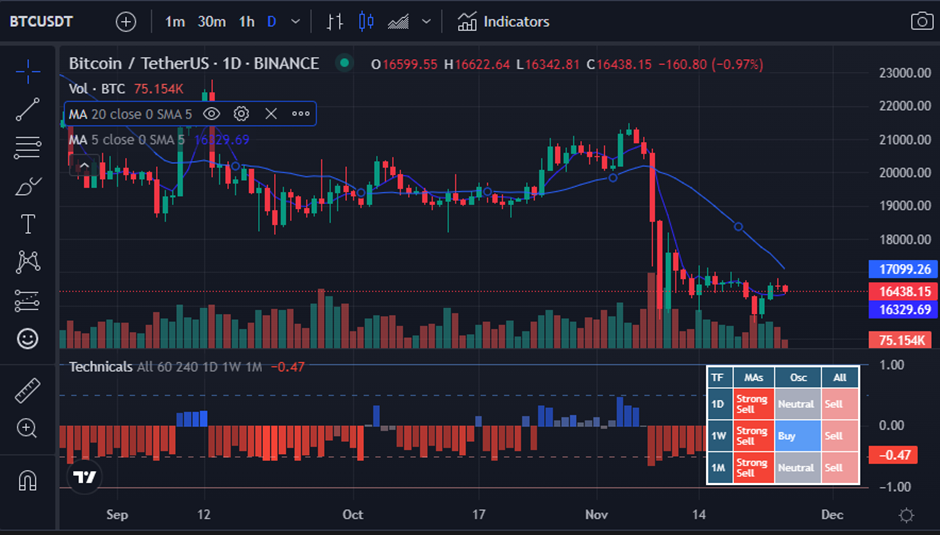
The Technical Rating indicator shows an order for a short position when it displays a “strong sell” signal with a value of -0.47 on the 1-day price chart, indicating an increase in selling pressure in the BTC market.
On the 24-hour price chart, the 20-day MA touches at 17099.47 and the 5-day MA touches at 16330.53. Since the short-term MA is crossing below the longer-term one, as evidenced by the MA readings, a bearish crossover is thus indicated, signaling that a bearish trend in BTC is likely to persist.
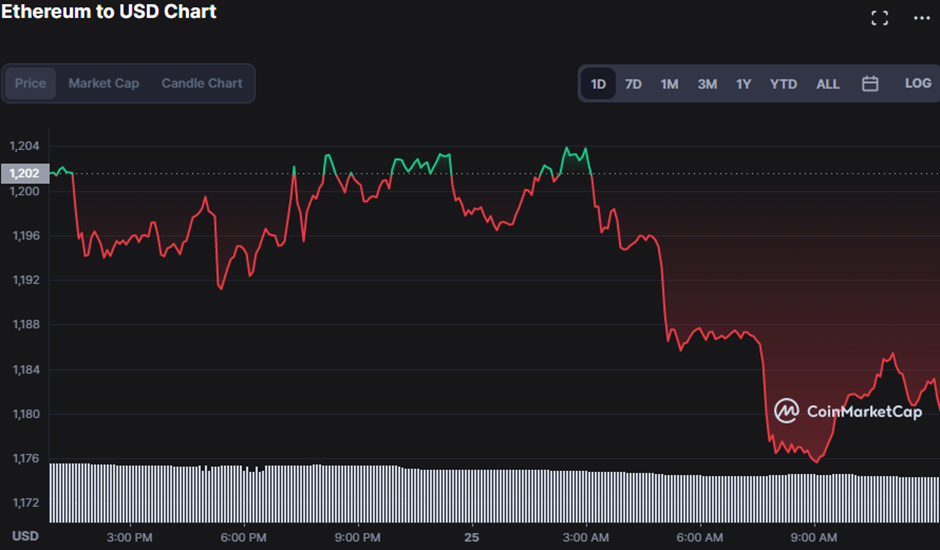
The price of Ethereum (ETH) has been steadily declining since hitting strong resistance at its intraday high of $1,203.98; it is currently down 1.83% at $1,179.55.
Its market capitalization and trading volume both fell, by 1.71% and 24.85%, respectively, to $143,506,221 and $8,482,980,648.
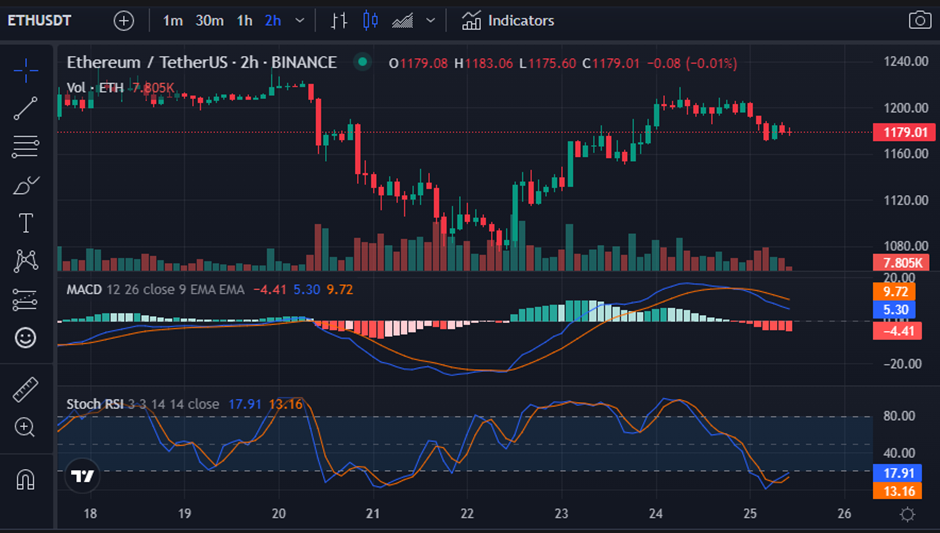
On the price chart for ETH, the MACD moves below the signal line with a reading of 5.41, while the signal line is at 9.74. The histogram, which trends in negative territory on the 2-hour price chart, supports this bearish point of view.
However, the Stoch RSI, which currently has a value of 19.27, swings in the oversold region and is pointing upward, giving ETH investors some cause for optimism. Although it is anticipated that the current bear trend will end at this point, there is no guarantee that the price will rise; this is just a warning.
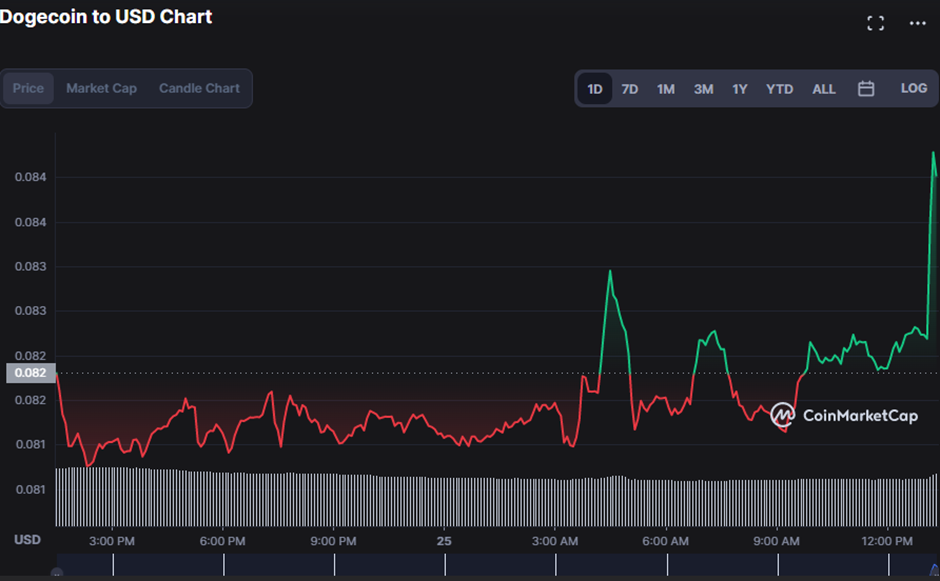
As prices rose to $0.08626 during the upturn, a 6.73% rise, Dogecoin (DOGE) bulls bucked the bear trend in the midst of the market crisis.
In support of this bull run, the market capitalization increased by 6.70% to $11,473,677,050. However, the daily trading volume decreased by 9.77% to $401,392,847, showing that buyers need to catch up to what sellers were hoping for.
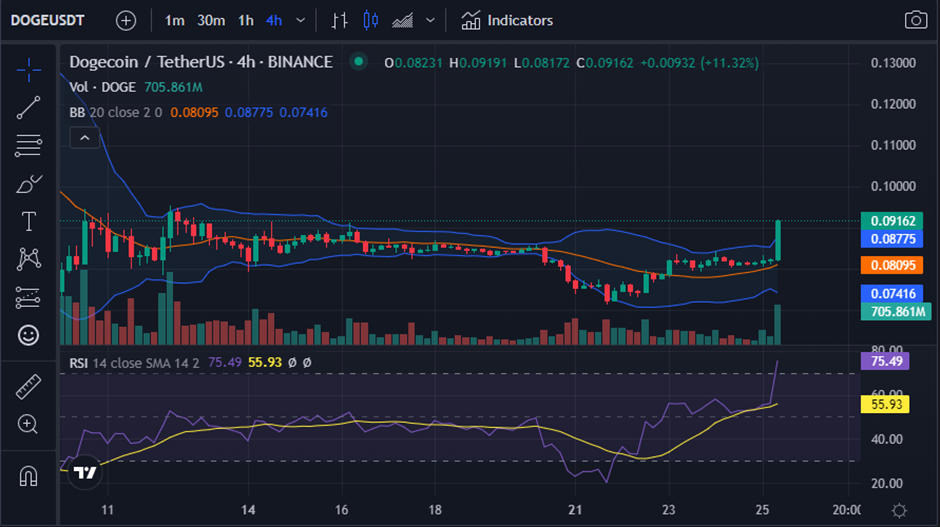
The Bollinger bands are widening, which is a bullish sign, as the top band touches at 0.08654 and the lower band contacts at 0.07500. Price movement above the upper range, which indicates that the current trend will continue, supports the bullish momentum in DOGE prices.
With a value of 73.58, the Relative Strength Index (RSI) is moving upward and toward the overbought area. If the indicator crosses into the overbought range, this trend warns traders about the potential for a price reversal.
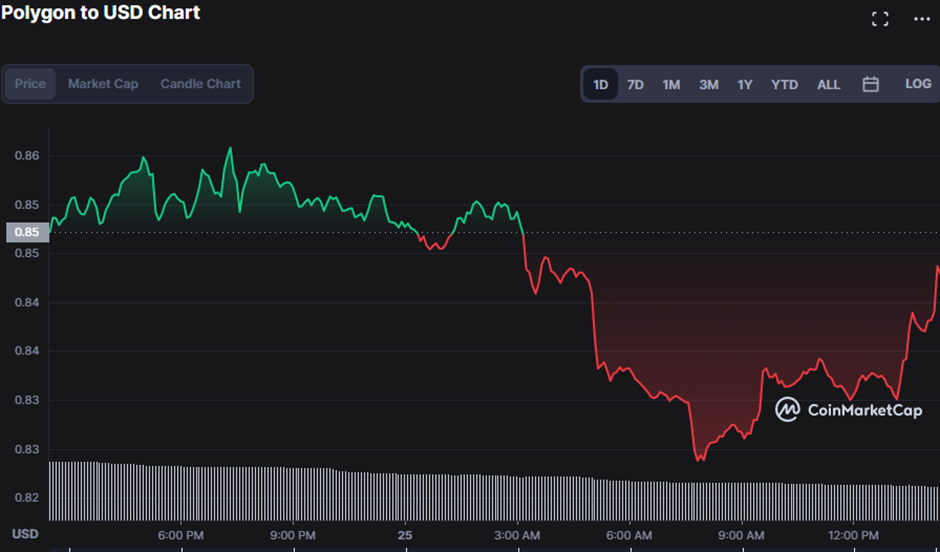
In the past day, the bears have flooded the Polygon (MATIC) market, sending prices down to $0.8427, a drop of 0.48%.
Also contributing to the decline were MATIC’s market capitalization and trading volume, which saw respective decreases of 0.47% and 43.02% to $7,368,237,771 and $267,445,785.
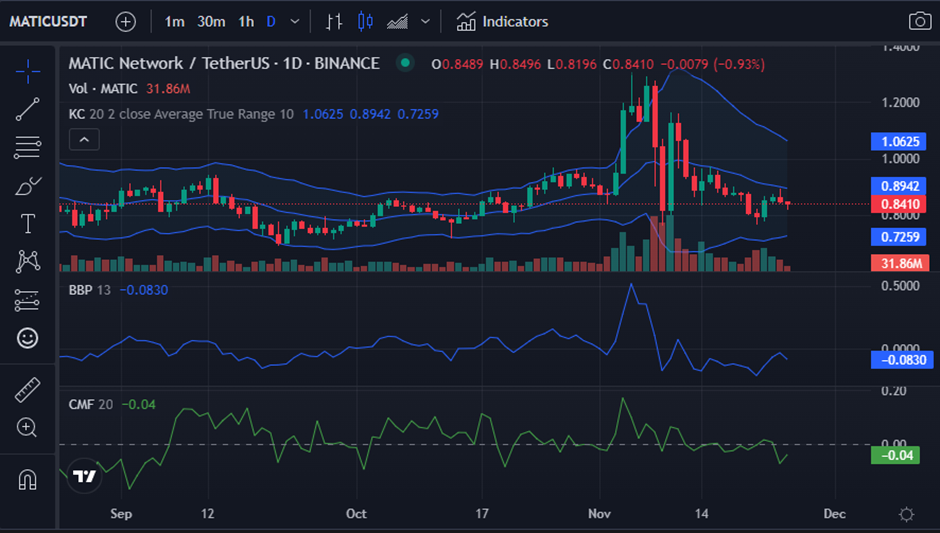
The upper and lower Keltner Channel bands are touching at 1.0627 and 0.7261, respectively, on the DOGE price chart, and are therefore contracting. The bears will triumph, as per the bands’ contraction. As prices move towards the lower band, the selloff increases since the typical tactic are to buy if the price breaks above the upper band or sell short if the price falls towards the lower band.
This bears dominance is supported by the movement of both the BBP and CMF in the negative zone below the “0” line, respectively, reading -0.0835 and -0.04. Although the BBP is moving downhill, the CMF is pointing upward, suggesting that the bulls are attempting to reverse the trend.
Bulls need to continue fighting and driving prices higher to buck this trend.
Disclaimer: The views and opinions, as well as all the information shared in this price analysis, are published in good faith. Readers must do their own research and due diligence. Any action taken by the reader is strictly at their own risk, Coin Edition and its affiliates will not be held liable for any direct or indirect damage or loss.
The post Prices of BTC, ETH, and MATIC Tumble as DOGE Bulls Assume Charge appeared first on Coin Edition.
1y ago•
bullish:
6
bearish:
3
Share

 Manage all your crypto, NFT and DeFi from one place
Securely connect the portfolio you’re using to start.

bullish:
0
bearish:
0

bullish:
0
bearish:
0

bullish:
0
bearish:
0

bullish:
0
bearish:
0