Uniswap price analysis: UNI bulls once again in trouble as the price reverts to the $5 level
1y ago
bullish:
0
bearish:
0
Share

The Uniswap price analysis indicates that the bearish momentum is once again accelerating. The price has significantly dropped over the last week, and today’s pattern is continuing that downward trend. The price has decreased today to $5.72, which has significantly lowered the worth of the cryptocurrency. The likelihood of the price continuing its downward trend is high.
UNI/USD 1-day price chart: Bearish candlesticks stretch out on the price chart
Given that the price has fallen again today, the bears are impressively retaining their advantage as per Uniswap price analysis. The price is currently at $5.72 and is anticipated to decline from this point in the near future. Another significant negative signal is the downward movement of the short-term trending line. When contrasted to the price level, the moving average is above it at the $6.07 level. The average of the Bollinger bands is currently sitting at the $6.03 mark.
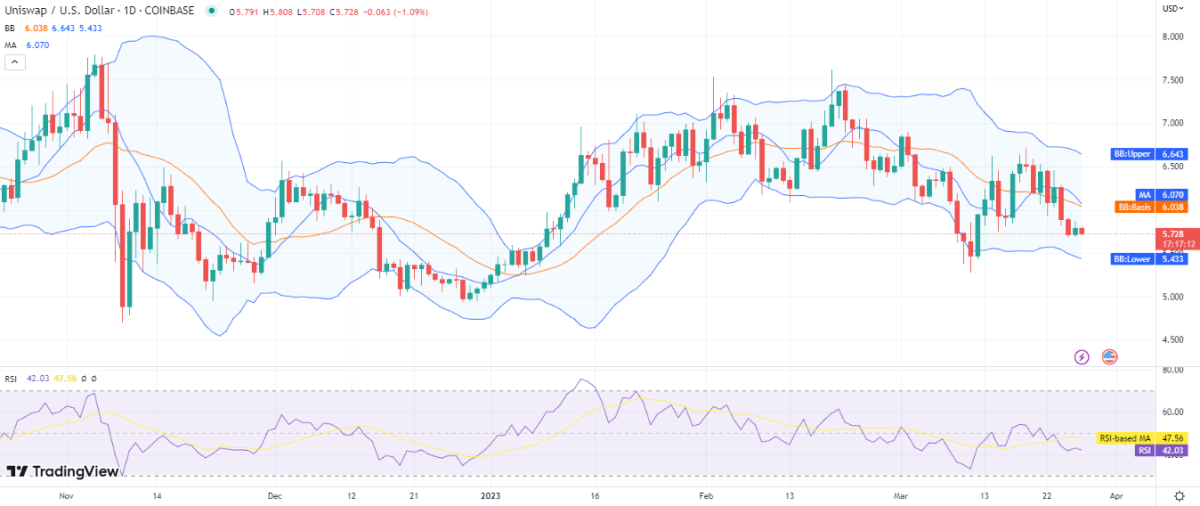
Given the high volatility and continuous downward movement of both Bollinger band ends, further price declines should be anticipated. As a result, the upper Bollinger band reached a value of $6.64, representing the resistance, and the lower Bollinger band reached a value of $5.43, representing the support. The RSI score is currently at 42, which is in the lower half of the neutral range, and is also trending lower, suggesting selling activity in the market.
Uniswap price analysis: Recent developments and further technical indications
The 4-hour Uniswap price analysis shows that, following the recent bearish onslaught, the bulls were unable to stage a comeback. The 4-hour price chart shows that the bears have effectively kept up their momentum and have once more secured their victory. The price has suffered a substantial loss and is currently at the $5.72 level. Due to recent downtrends, the moving average (MA) is currently $5.76, which is a little higher than the price value.
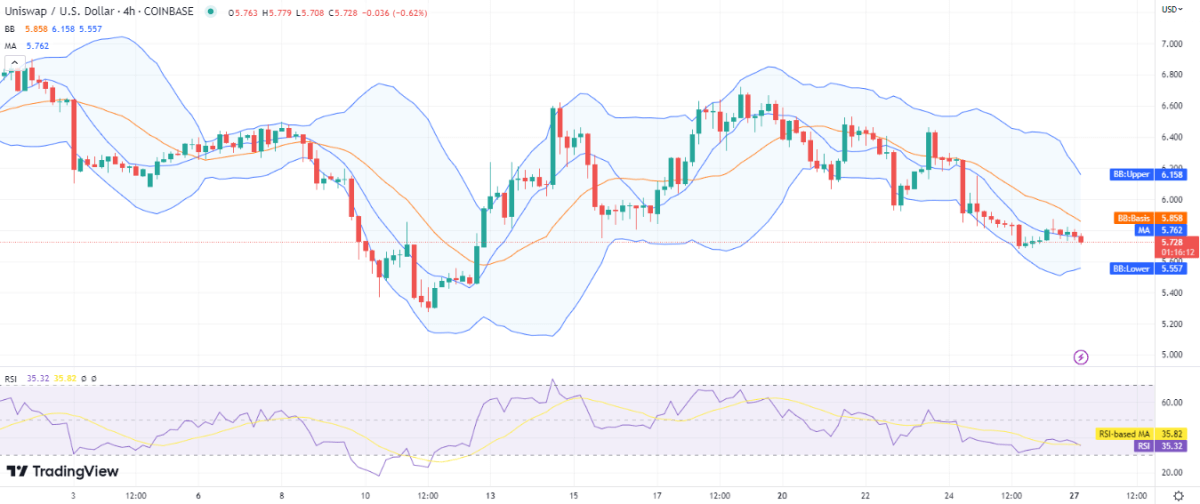
Although the Bollinger bands are rapidly converging, the volatility has considerably decreased throughout the day but is still high. As a result, the value of the upper Bollinger band has reached $6.15, and the value of the lower Bollinger band has reached $5.55. The Relative Strength Index (RSI), which today dropped to index 35, is once again confirming the downward pattern.
Uniswap price analysis: Conclusion
The one-day and four-hour Uniswap price analysis shows that the bears are currently dominating the game. Uniswap’s valuation has dropped, and as of this writing, it is only worth $5.72. Since the downtrend hasn’t changed in the last week, it is expected to continue for some time to come. The support level at $5.56 will shortly be retested by the price as it searches for a new low.
1y ago
bullish:
0
bearish:
0
Share


 Manage all your crypto, NFT and DeFi from one place
Securely connect the portfolio you’re using to start.

bullish:
0
bearish:
0


bullish:
0
bearish:
0

bullish:
0
bearish:
0