Dogecoin price analysis: Bullish pattern resumes as DOGE price recovers back to $0.074
1y ago
bullish:
0
bearish:
2
Share

A rise in price is predicted by the Dogecoin price analysis as of right now. Following the correction that occurred over the course of the previous two trading days, price levels have risen once more as bulls maintain their position of leadership. The present coin value, following an increase in the price, is $0.074. Bullish activity has been strong over the last few hours, but the most recent pattern has been in their favour. The price has increased significantly, and it’s expected to get better still.
DOGE/USD 1-day price chart: DOGE to try $0.076 again as resistance
The 24-hour Dogecoin price analysis shows that the DOGE/USD pair is still moving upward as bulls are now looking for the $0.077 resistance level, which is still a little above to be tested. The bulls’ next objective will be to reach the previous high of $0.076, which was last seen on March 21, 2023. The price dropped the very next day, though, so the bulls were unable to maintain their position for very long, however, bulls made another attempt and crossed this level on March 23, 2023, as well, but, a correction followed suit. If the bulls are able to break the price a little higher, this will now be the next barrier they will run into.
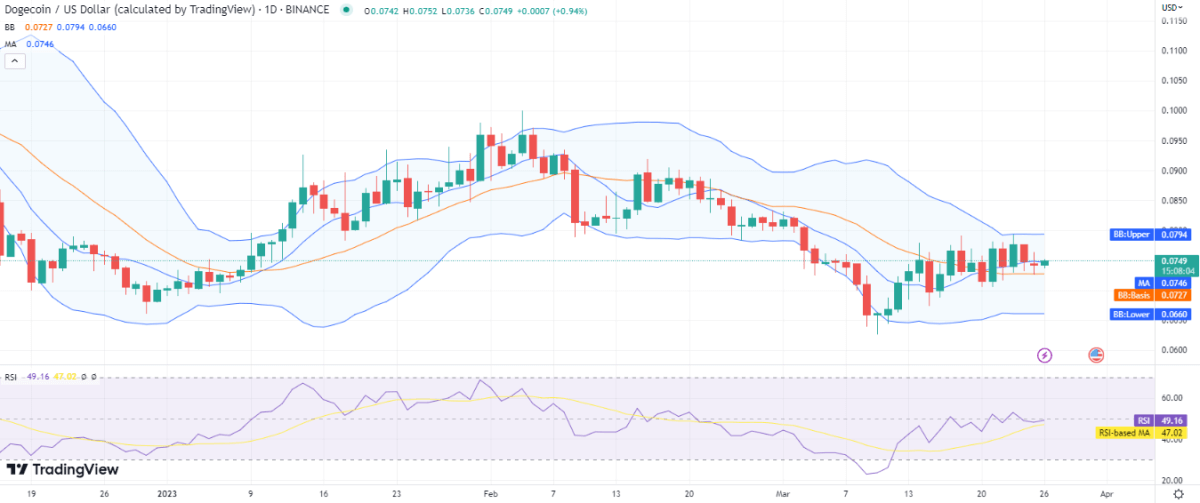
The DOGE/USD pair has gained 0.94 percent overall over the past week and 0.30 percent over the preceding 24 hours. As a consequence, while the trading volume has decreased by 35.34 percent today, the market cap has increased by 0.43 percent.
The price is fluctuating between the upper limit and the mean average line of the volatility indicator, which indicates that volatility is significant. which suggests a generally encouraging future indication. According to the Bollinger bands, the greatest support for DOGE is at $0.066, and the upper band, which represents resistance, is at $0.079. The Relative Strength Index (RSI) is rising at index 49, and the curve depicts market buying action. It is a bullish crossover when the price crosses over the moving average (MA) at the $0.074 level.
Dogecoin price analysis: Recent developments and further technical indications
The 4-hour Dogecoin price analysis data shows that DOGE is still trading higher as it has been moving upward for the last 16 hours, with minor corrections occurring over the last four hours. Bulls raised the price at the start of the trading day and are still doing so as they move the price upwards.
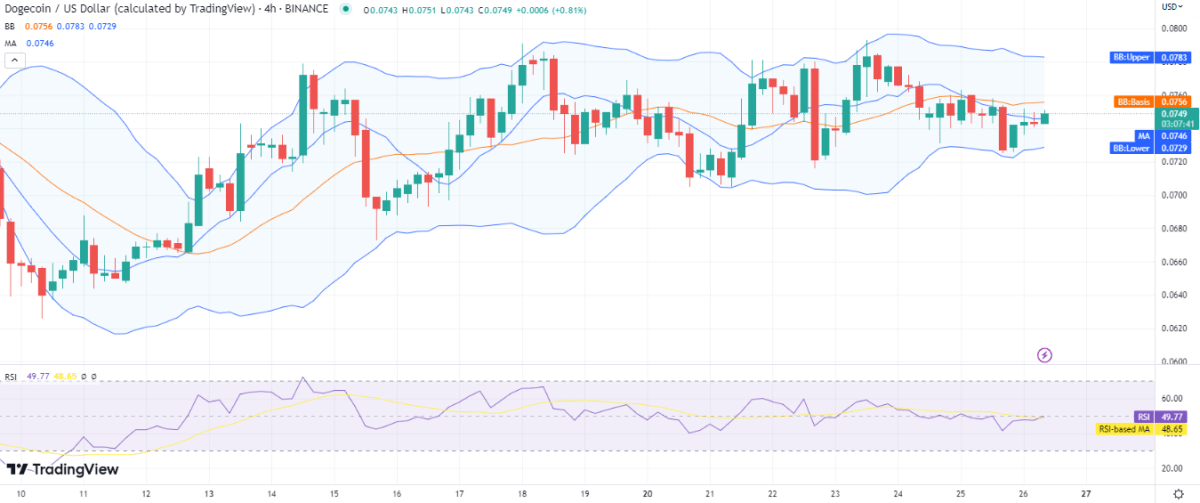
High volatility is a sign that the future is likely to be comparatively positive. The Bollinger bands indicate the upper band at $0.078, which stands in for DOGE’s resistance, and the lower band at $0.072, which stands in for DOGE’s strongest support. The curve is still moving upward, suggesting slow purchasing activity in the market, and the Relative Strength Index (RSI) is hovering close to the neutral region’s centre line at index 49.
Dogecoin price analysis conclusion
The dogecoin price analysis shows that the cryptocurrency is currently on the rise. The price levels are recovering significantly; a sizable amount of loss has been made up for as bulls work to break through the next barrier. For the buyers, it will be extremely encouraging if the crypto pair can hold its price at these levels for the ensuing days.
1y ago
bullish:
0
bearish:
2
Share

 Manage all your crypto, NFT and DeFi from one place
Securely connect the portfolio you’re using to start.

bullish:
0
bearish:
0

bullish:
0
bearish:
0

bullish:
0
bearish:
0

bullish:
0
bearish:
0