Stellar price analysis: Bulls keep raising the bar as XLM reaches $0.104
1y ago
bullish:
3
bearish:
0
Share

The Stellar price analysis shows that the cryptocurrency is displaying a strong bullish character due to its unrivaled performance. As they have been doing for the past few days, the bulls are still driving the price upward. Given that the price has now risen to $0.0194, the positive effect has proven to be persistent. The trend line is rising as a result of the bulls’ sustained advantage over the last six days. However, on the hourly chart, the price is going down at the moment as there seems to be strong resistance at $0.106 before the bulls can challenge the $0.109 hurdle.
XLM/USD 1-day price chart: buyers to outperform their rivals
The most current Stellar price analysis shows that the bullish momentum grew until midday. Stellar Price has also seen some significant gains over the past week as the bulls have taken control of the market. But as of right now, the trends are also bullish, as the price has risen to the $0.104 level, adding 3.20 percent to its value in the previous day. The price levels have also surpassed the moving average (MA), which is $0.094; thus, the advancement is discernible.
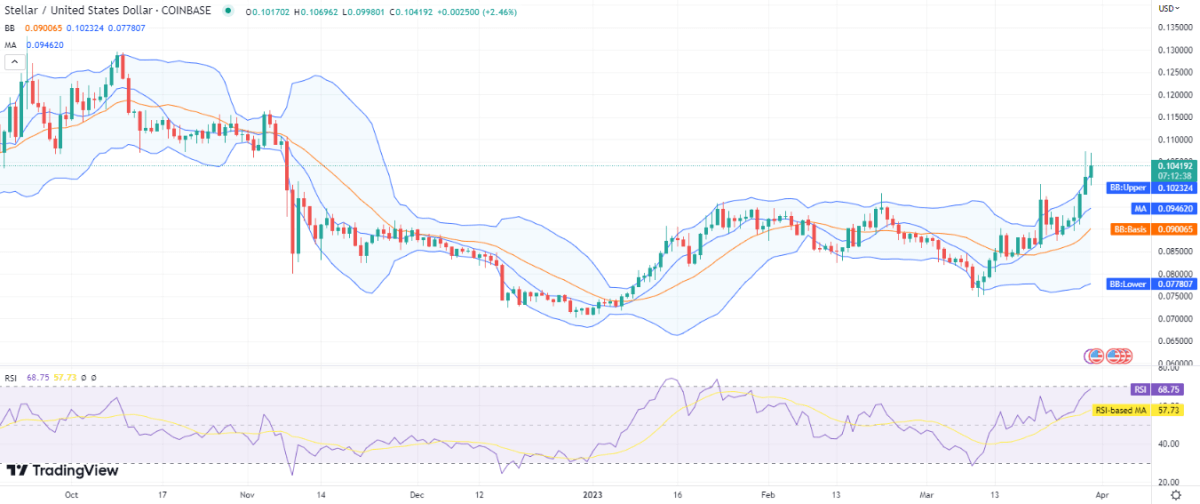
Since the Bollinger bands have widened, volatility has also been increasing, as shown by the expansion of the bands. Together with the $0.102 higher value and $0.077 lower value, the Bollinger bands are also breaking upward. Additionally, the Relative Strength Index (RSI) score is continuing its upward trend and trading at index 68 at the time of writing, which indicates that it is moving towards the overbought level.
Stellar price analysis: Recent developments and further technical indications
The 4-hour Stellar price analysis shows bulls were quite aggressive for the first eight hours of the day’s trading session, as they spiked the price towards the $0.106 level. But this triggered the selling pressure, and a correction has been observed during the last eight hours. The Stellar price, despite closing in green yesterday, also faced rejection near the same level. This proves that a strong resistance is present at $0.106, and bulls need to gear up more strength to break above the said level. The price is present above the moving average value, which, on the other hand, is at the $0.103 level.
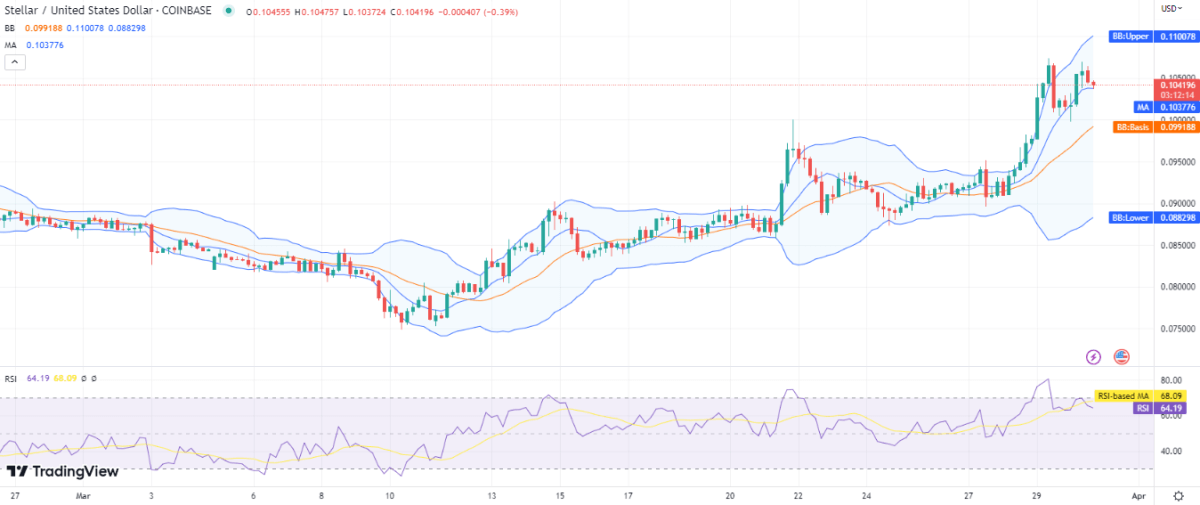
On the 4-hour chart, the volatility has been rising, which is encouraging for the future of Stellar. The Bollinger bands indicator’s higher value is set at $0.110, while its lower value is fixed at $0.088. Due to the current uptrend, the RSI score has also been rising quickly; however, it reversed after reaching a level of 70 and is now at 64.
Stellar price analysis conclusion
As can be seen from the provided Stellar price analysis, the tides are shifting in a bullish direction. Since a few days ago, the bulls have been moving along rather quickly. The increase in Stellar’s price, which has now reached $0.104 in worth, serves as confirmation of the uptrend. Today XLM is expected to close higher than yesterday’s price cap as bulls seem to be moving towards their initial target of $0.106 and then finally towards $0.109.
1y ago
bullish:
3
bearish:
0
Share

 Manage all your crypto, NFT and DeFi from one place
Securely connect the portfolio you’re using to start.

bullish:
1
bearish:
1


bullish:
2
bearish:
0