Ethereum price analysis: ETH slowly retests $1,270, reaction higher overnight?
0
0

Ethereum price analysis is bullish today as we have seen consolidation around $1,250 after buyers failed to return overnight. Therefore, the current quick retest of previous support will likely be enough for ETH/USD to rapidly continue higher over the next 24 hours.
ETH/USD traded in a range of $1,249.91 to $1,290.06, indicating mild volatility over the last 24 hours. Trading volume has increased by 35.80 percent, totaling $6,783,725,789, while the total market cap traded around $156.1 billion. Ethereum is trading at $1,276.15, up by 2 percent in the last 24 hours.
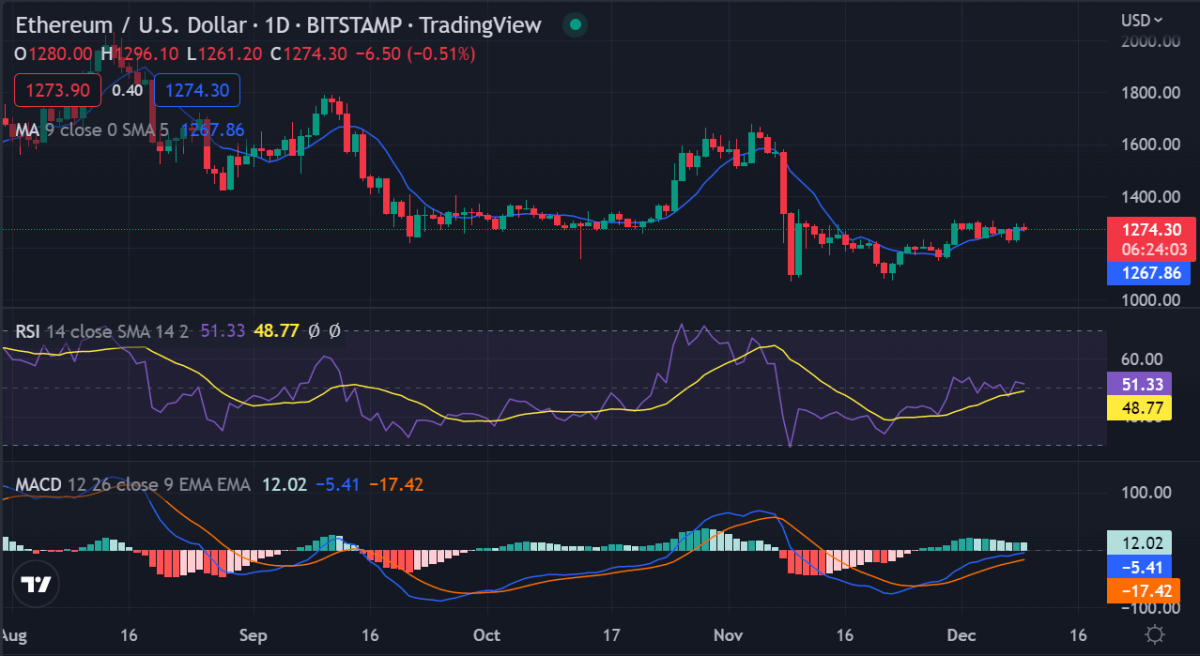
Ethereum price analysis shows the ETH/USD has been trading within a relatively narrow range during the past several days. Ethereum price chart shows that the bulls have so far defended any meaningful declines, with the nearest support level lying around $1,100. ETH/USD had rallied above t $1,286 and is trading around the $1,281.63 mark at press time. The 100 EMA line has broken out in a bullish manner after being previously trapped below it for several weeks.
Ethereum price analysis on a daily chart: ETH prepares to continue higher?
Ethereum price action reveals ETH has traded in a consolidation over the past week. After the previous retrace ended at $1,000, ETH/USD found a consolidation area above $1,100, where no significant price action development took place until Friday.
The immediate resistance is seen at $1,300 followed by $1,308 and $1,317. On the other hand, if the price fails to continue rising, supports can be located at $1,250 followed by the 20-day EMA line at $1,220, and finally at $1,196.

The Relative Strength Index indicator is residing at the neutral 56 level, which indicates the price is neither overbought nor oversold. In addition, the MACD line has crossed upward and broke through the signal line for a bullish crossover.
Therefore, we expect the Ethereum price to move higher once again to set another lower local high over the next few days. From there, ETH/USD should attempt another break higher, likely to the $1,300 resistance.
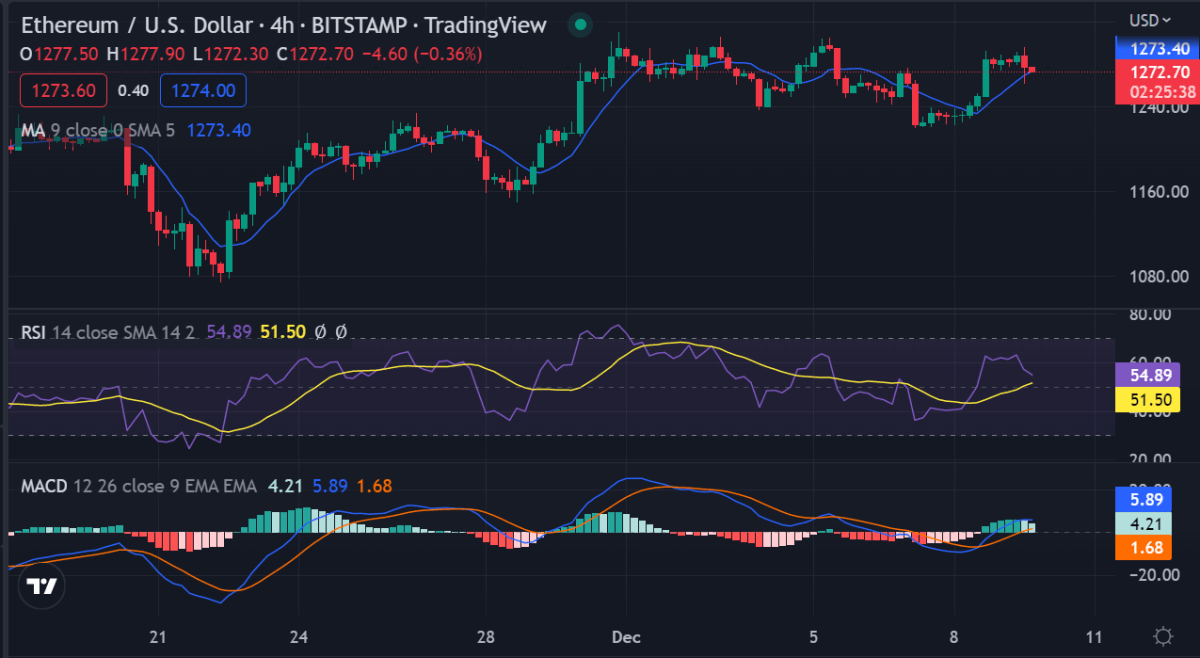
Ethereum price analysis on 4-hour chart: ETH eyes $1,300
Ethereum price analysis on a 4-hour chart shows the bulls have difficulty gaining upside momentum.ETH/USD is trading within a sideways channel. The bulls have managed to defend $1,150 as support for the past few weeks and have been priced to inch closer to $1,300. ETH/USD pair has been stuck in a sideways pattern and is trading in the close vicinity of $1,260.

Currently, Ethereum price tests the downside around $1,200 support with low momentum, likely leading to a reversal soon. Therefore, ETH/USD is ready to push even higher as the local low is set in a clear way. Once buying pressure returns, we expect next week to start with another wave higher.
Ethereum price analysis conclusion
Ethereum price analysis shows ETH is still consolidating and this period of stability could remain intact for another week or two. The bulls are still struggling to push the price above the resistance at $1,366.74 and it is likely that they will need another few days in order to do so. However, we can expect a significant move very soon as we have reached a critical level of consolidation.
While waiting for Ethereum to move further, see our Price Predictions on XDC, Cardano, and Curve.
0
0


