Bitcoin’s Horizontal Levels Show Potential For Bullish Trend
1y ago
bullish:
2
bearish:
0
Share
After recovering its bullish momentum, the largest cryptocurrency in the market, Bitcoin (BTC), briefly broke above its key resistance level of $28,700. However, the cryptocurrency retracted and returned to trading within its range formed in the last week between $27,600 and $28,500.
Despite this choppy price action, a recent blog post by Justin Bennett, trader and analyst of the crypto market suggests that BTC has established “strong” horizontal levels, which are favorable for both scalpers and investors who prefer this period of range or consolidation in the market.
Will These Horizontal Levels Hold A Potential Decline In BTC’s Price?
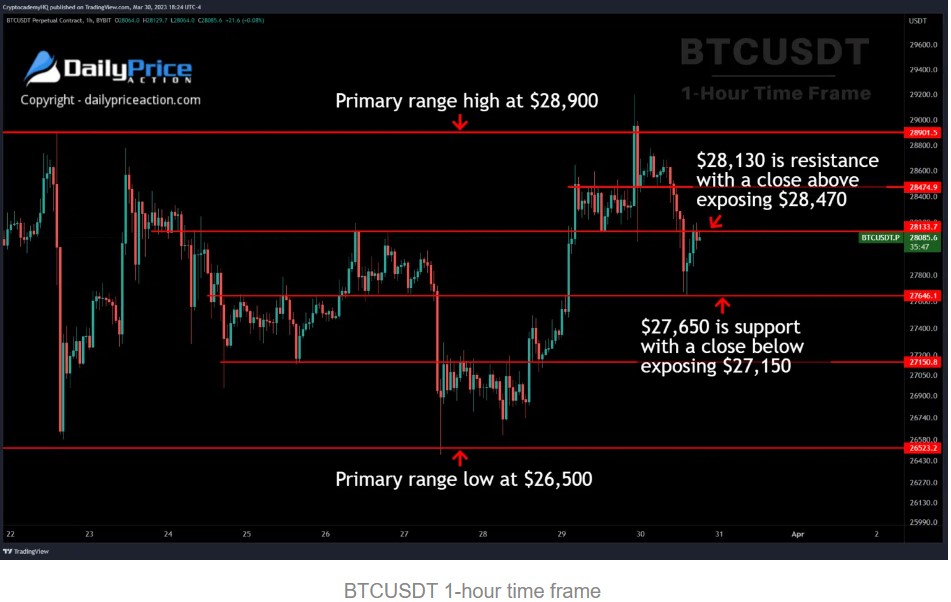
Bennett further mentions that Bitcoin trades above the $28,130 pivot point on an hourly and 4-hour closing basis. Any attempt to retest this level will likely attract sellers, potentially triggering another run at the $27,650 support floor and potentially lower prices.
Although the horizontal levels seen in the chart may provide opportunities for scalping, Bennett cautions that there is a potential downside risk if BTC’s support levels are breached.
Bennett suggests that while BTC’s price has no confirmed direction, there are currently more long liquidations below the price than short liquidations above. This means that a higher number of traders have taken long positions and may be at risk of liquidation if the price further declines over the weekend.

However, with Bitcoin trading above the key pivot point, there is still potential for further upside and consolidation above the $29,000 level. The $28,900 macro resistance level is the next target for BTC, and a successful breach could lead to further gains for the largest cryptocurrency in the market.
Bennett further suggests that the primary range for Bitcoin is between $26,500 support and the $28,900 resistance wall, with smaller ranges within this range. This can result in the price movement may be relatively stable within this range. Still, there is a potential for significant volatility if the price breaks out of this range and experiences a correction toward the support level.
A New Cycle Is Just Beginning For Bitcoin
According to Rekt Capital, with the closure of Q1 for Bitcoin and the broader cryptocurrency market, BTC is on the verge of confirming its first bullish quarterly engulfing candle since early 2020. This pattern occurs when the opening price of a particular quarter is lower than the closing price of the previous quarter.
According to Rekt, this pattern has historically preceded multiple quarters of upside for Bitcoin, meaning that BTC’s price tends to increase for several quarters after the pattern is confirmed, like in the bull market of 2021.

Even if Bitcoin’s price experiences a pullback in the near term, the sentiment of the cryptocurrency market seems to aim for one thing: BTC is poised for a new bull run.
The market is expected to undergo a sustained period of price increases in the coming months, with the first quarter closing above key levels. This suggests strong potential for growth and investor confidence despite short-term fluctuations in Bitcoin’s price action.

Featured image from Unsplash, chart from TradingView.com
The post Bitcoin’s Horizontal Levels Show Potential For Bullish Trend appeared first on .
1y ago
bullish:
2
bearish:
0
Share


 Manage all your crypto, NFT and DeFi from one place
Securely connect the portfolio you’re using to start.

bullish:
0
bearish:
0


bullish:
0
bearish:
0

bullish:
0
bearish:
0