Cardano price analysis: ADA eyes key resistance of $0.3895 as bullish momentum builds
1y ago
bullish:
1
bearish:
0
Share

The Cardano price analysis reveals that the token is trading on an upward trajectory in the past 24 hours. The bulls have gained control of the market with buyers taking the price higher. ADA/USD is currently trading at $0.3855, after a high intraday of $0.3895, and has seen an increase of 9.41% in the past 24 hours. The ADA/USD pair is now eyeing a key resistance level of $0.3895, which could be the next major hurdle that buyers need to cross. A break above this level would open up more upside potential and confirm that the bulls are in control.
Cardano price analysis 1-day chart: Bulls surge ADA/USD towards the $0.4 level
On the 1-day chart, Cardano price analysis has seen a sharp rally and is forming an ascending triangle pattern. ADA has had tremendous buying pressure as buyers are taking control of the market and a further upside momentum could be on the way. The trading volume has seen an impressive increase too as it stands at $486 million signifying the presence of strong buyers, while the market cap currently stands at $13.38 billion.
The Relative Strength Index (RSI) score is increasing with the indicator reaching the 59.93 mark whereby the upward curve of the indicator hints at the buying activity of the altcoin. The volatility is increasing with Bollinger bands expanding, thus indicating a strong bullish trend for Cardano. The upper and lower Bollinger Band is at 0.3856 and 0.3076 respectively.
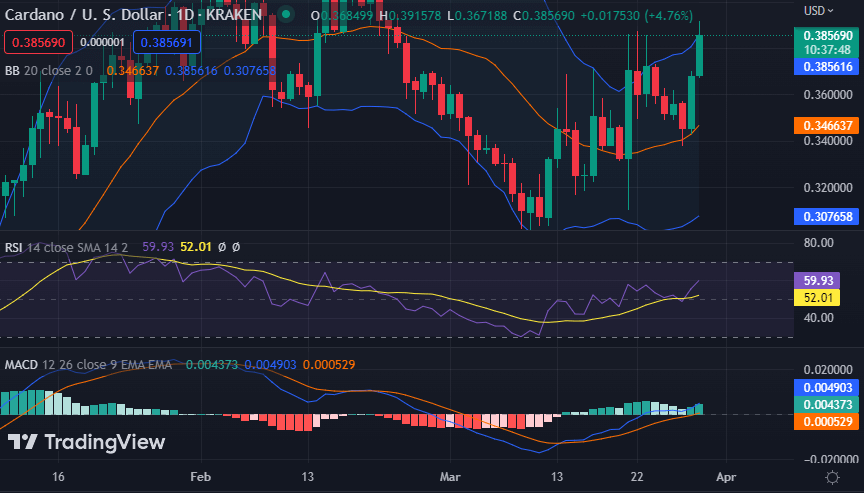
In addition, the Moving Average Convergence Divergence (MACD) line is currently above the signal line indicating a positive outlook. The MACD histogram signifies strong buying activity for ADA/USD as the green bars keep pushing higher.
Cardano price analysis 4-hour chart: Recent updates
The 4-hour Cardano price analysis indicates that the prices are currently trading in a rising wedge pattern which shows a bullish continuation pattern that typically signals further upside potential in the market. However, the bulls need to push the prices above the $0.3895 resistance level to confirm the bullish trend’s continuation and move toward $0.4000, which is the next major resistance.
The technical indicators on the hourly chart also present a bullish outlook. The MACD line is still above the signal line while the histogram keeps pushing higher, signifying strong buying pressure in the market. In addition, the RSI has risen further towards the overbought region at 69.60, which is indicative of bullish market sentiment.
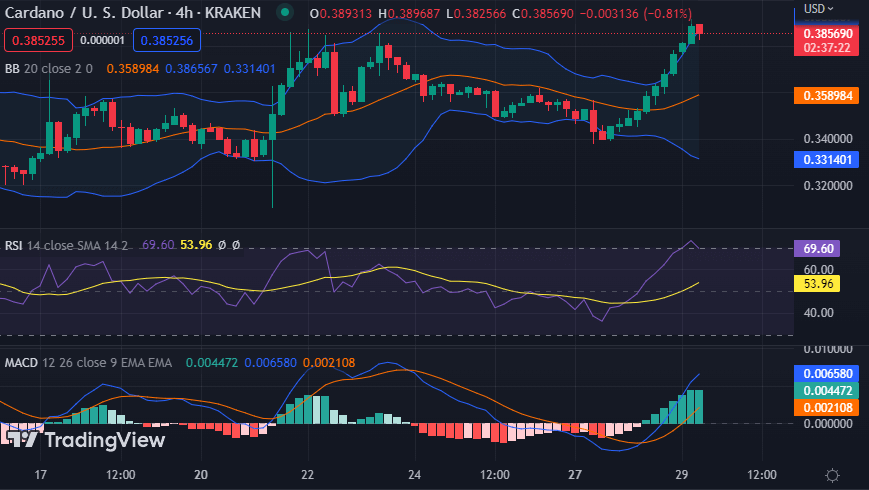
Furthermore, the Bollinger Bands are expanding, indicating increased volatility in Cardano, which could lead to further upside momentum. The upper band is at 0.3865 and the lower band at 0.3314 respectively.
Cardano price analysis conclusion
Overall, the Cardano price analysis reveals that the altcoin is currently facing strong buying pressure from buyers, which could take the price higher if they are able to break the key resistance level of $0.3895. However, a break below the support level could cause a pullback in ADA/USD as well. Meanwhile, technical indicators on both the 1-day and 4-hour charts are showing bullish signals, indicating further upside potential for Cardano.
1y ago
bullish:
1
bearish:
0
Share


 Manage all your crypto, NFT and DeFi from one place
Securely connect the portfolio you’re using to start.

bullish:
0
bearish:
0

bullish:
0
bearish:
0

bullish:
0
bearish:
0

bullish:
0
bearish:
0