Dogecoin price analysis: DOGE suffers further setback after 5 percent loss today
2
3

Dogecoin price analysis turned severely bearish over the past 24 hours, as price dropped down past the $0.069 support zone to incur a 5 percent decline. DOGE dropped from its long-standing support around the $0.07 mark with today’s dip, and is expected to lower further down to $0.063. Dogecoin price has endured a forgettable month of December, falling more than 45 percent since December 5 when price was at a high of $0.11.
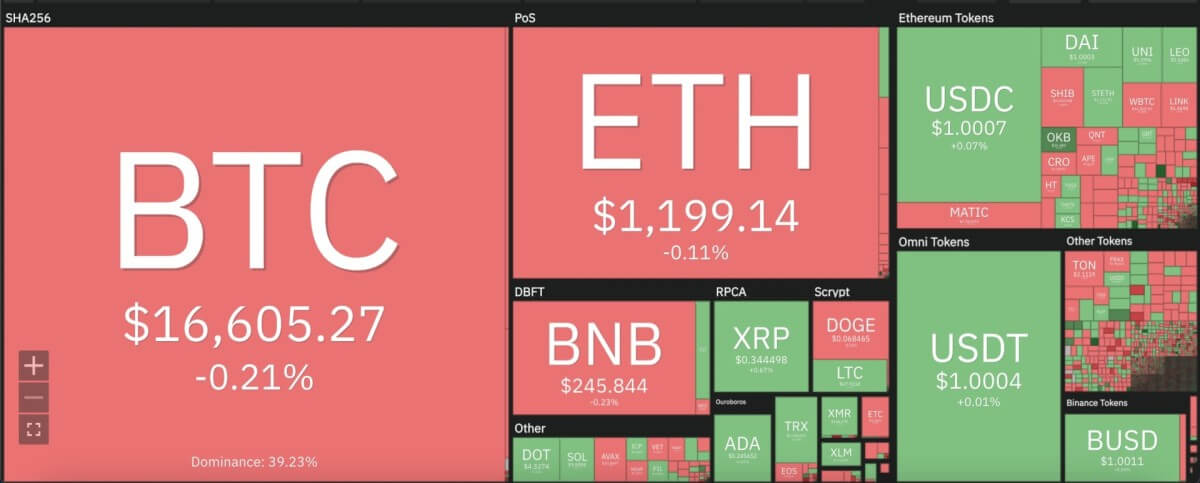
The larger cryptocurrency market also remained bearish over the past 24 hours, as major cryptocurrencies recorded minor losses against yesterday’s trends. Bitcoin fell further away from its pursuit of the $17,000 mark after dropping down to $16,600, while Ethereum remained below $1,200. Among leading Altcoins, Ripple rose to $0.34, and Cardano to $0.24. Meanwhile, Polkadot sits at $4.32 and Solana rose 3 percent to move up to $9.89.

Dogecoin price analysis: DOGE falls further below crucial moving averages on daily chart
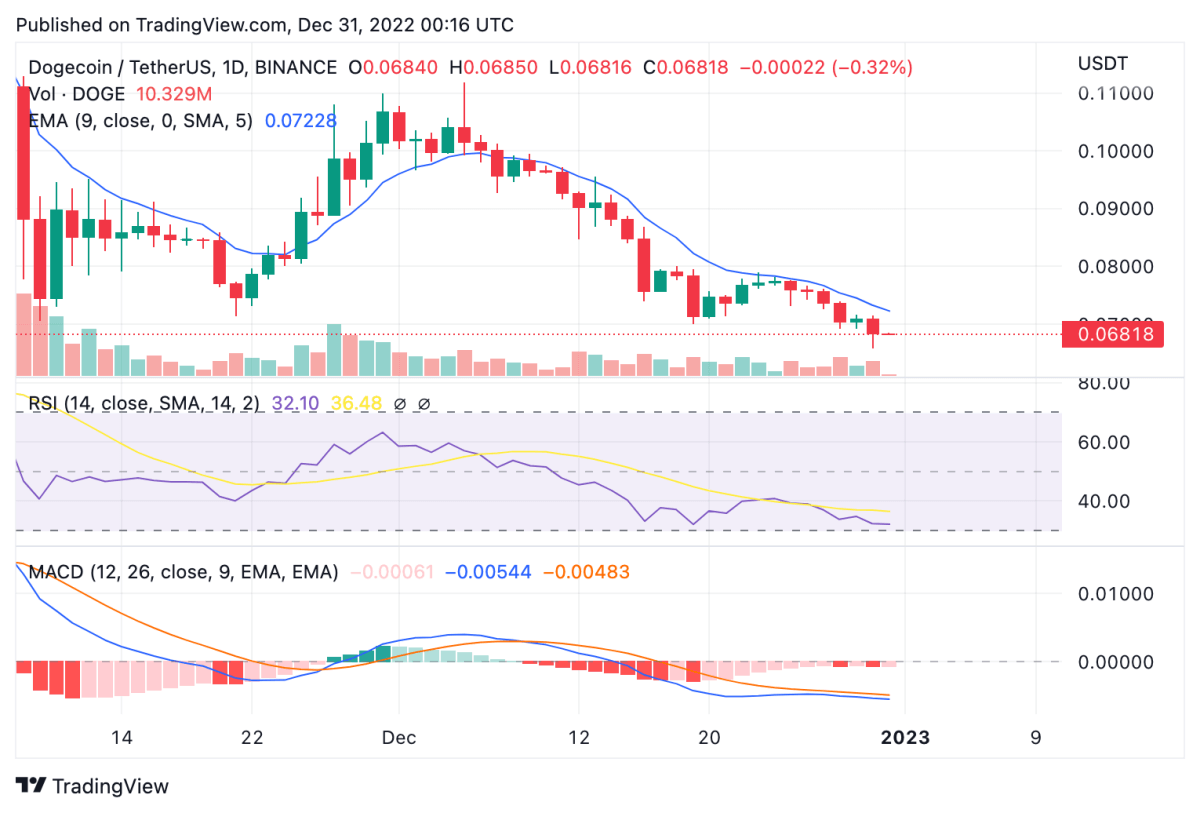
On the 24-hour candlestick chart for Dogecoin price analysis, price can be seen forming a descending triangle pattern since December 25 to fall as low as $0.066. With further decline set in place, trading volume over the past 24 hours rose up to 48 percent, indicating selling as the major market action. Meanwhile, with today’s 5 percent decrement, DOGE price fell further apart from the 9 and 21-day moving averages, along with the crucial 50-day exponential moving average (EMA) at $0.072.

Meanwhile, the 24-hour relative strength index can be seen depleting further into the oversold zone at the 32 mark. If price is to form a rebound, the RSI movement up to the 45 mark will be crucial. Furthermore, the moving average convergence divergence (MACD) curve continues to show a bearish divergence, with the trend line continuing below the signal line.
Disclaimer. The information provided is not trading advice. Cryptopolitan.com holds no liability for any investments made based on the information provided on this page. We strongly recommend independent research and/or consultation with a qualified professional before making any investment decisions.
2
3


