Ethereum price analysis: Bullish momentum starts building as ETH remains above $1,200
9
4

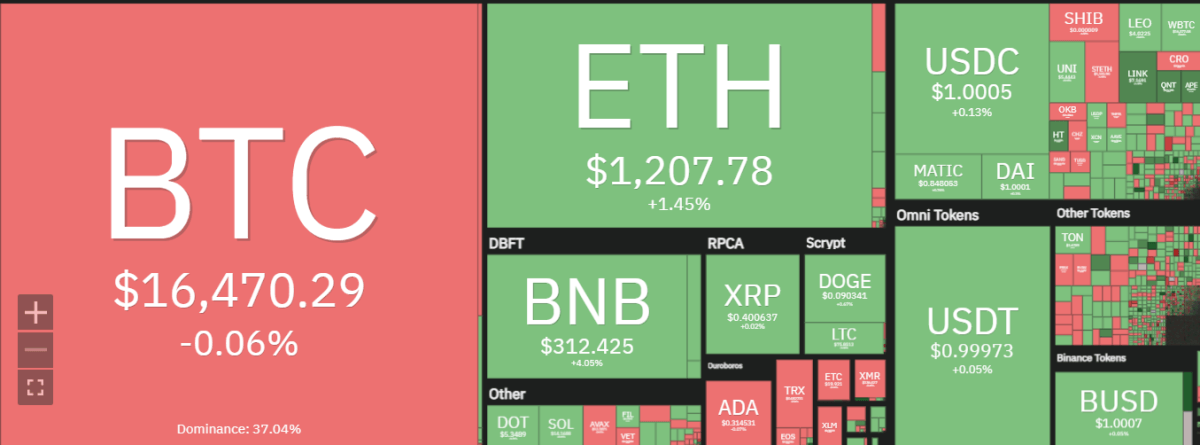
Recent Ethereum price analysis shows a slightly bullish sentiment taking over the digital currency’s price. ETH/USD value has been consolidating within a tight range of $1,190.19 and $1,227.04 for some time now. The consolidation is quite bullish because although it has also pushed a few sellers off their positions, it hasn’t seen any drastic damage to the bullish momentum. Ethereum is trading at $1,210.84 at the moment, up by 1.65 percent in the last 4 hours.

In fact, we are starting to see some signs that ETH/USD might be breaking out of this range soon and moving higher. The next major support for ETH/USD lies at $1,190.0, which is quite close to its current price levels. If it manages to break above $1,227.04, there could be a push to $1,300.00 or even as high as $1,400.00 in the near future.
ETH/USD price analysis on a 4-hour chart: Consolidation above the $1,200 range
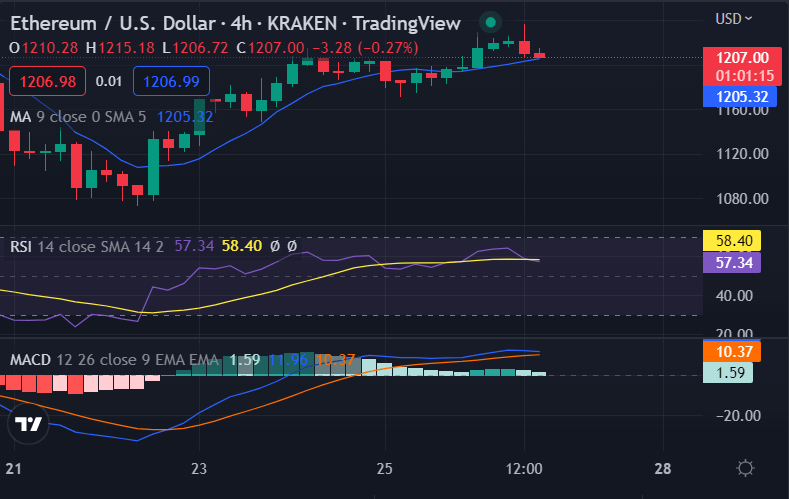
Ethereum price analysis shows a low volatile price action taking over the 4-hour chart. At press time, Ethereum’s price is consolidating above $1,200 and remains relatively stable on a day-to-day basis.
ETH/USD had spiked briefly to over $1,280 last week after finding resistance at the mid-$1,200 range. However, the digital currency fell back below $1,250 soon after. Currently, it is trading in a tight range of $1,190.19 and $1,227.04 and could be on the verge of breaking out towards the upside if it consolidates around these levels for a while longer.
The 200 SMA is slightly below the 50 SMA, showing that the path of least resistance could be to the downside. In addition, Ethereum’s price is below these moving averages, which suggests that bearish pressure is more dominant than bullish momentum at this point.

Meanwhile, RSI has moved higher into overbought conditions but hasn’t turned down just yet as a signal that buyers are still in control. Also, stochastic is turning higher to reflect an increase in buying pressure right now.
As it stands, Ethereum price analysis indicates that more consolidation could take place before the value finds enough momentum to break out of the tight range and move towards $1,300 or even as high as $1,400. However, a break below $1,190.0 could lead to a selloff back towards $1,150.00 or even lower if the bears gain more traction.
Ethereum price analysis on a daily chart: ETH/USD remains above $1,200
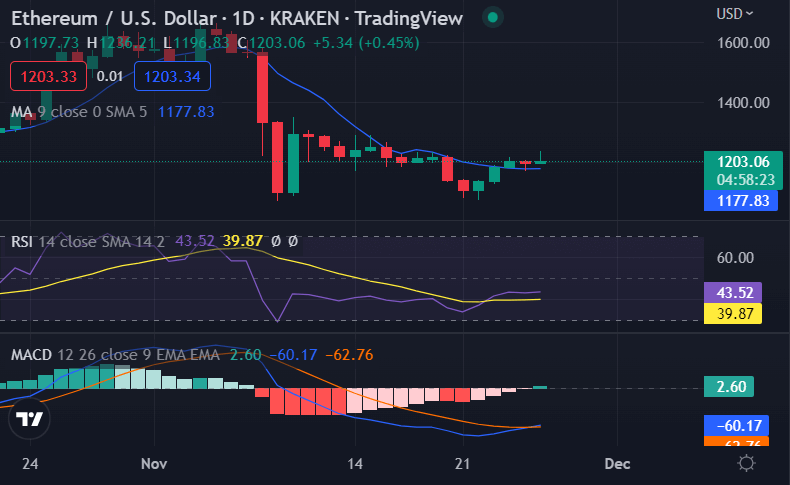
Ethereum price analysis on a daily chart shows bears have been dominating the market since the early hours of the day and the price has been stuck below $1,200.00.
The technical indicators at press time indicate that the selling pressure is likely to intensify in the short term. Sometimes, when an asset has a bearish bias, it struggles to break out of key support levels such as $1,200.00 or even $1,150.00. Also, Ethereum’s price had broken below its 20 and 50 SMA on the 4-hour chart.
The RSI indicator is deep in the bearish zone, indicating that ETH/USD could see more losses in the short run. The Stochastic indicator also reflects a similar sentiment as it moves further lower into oversold territory.

Considering how this might be an indication of an impending breakdown below $1,190.00, bears could aim for the 61.8% Fib retracement level of the last rise from $1,150.00 to $1,350.00 at $1,122.00 or possibly a bearish flag pattern support located around $1,135.00 next week if bulls fail to defend the current price levels soon.
On the upside, a sustained break and close above $1,200.00 could be an indication that further gains toward $1,320.00 could follow quickly. However, this shall not hold true as long as ETH/USD is trading below its 20 SMA on the 4-hour chart or even if it falls back to its 50 SMA, which could happen soon.
Ethereum price analysis conclusion
Ethereum price analysis shows that the digital currency is still below $1,250.00 and bulls need to rally past this psychological level in order to gain more strength or buyers will continue to dominate the market. Ethereum price could attempt a push toward $1,300.00 next week if it holds at current levels for longer.
Disclaimer. The information provided is not trading advice. Cryptopolitan.com holds no liability for any investments made based on the information provided on this page. We strongly recommend independent research and/or consultation with a qualified professional before making any investment decisions.
9
4


