Polkadot price analysis: Bullish swing results in price climbing above $6.43
1
0

Polkadot price analysis for today shows that the cryptocurrency has seen a bullish breakout from a symmetrical triangle pattern. The breakout from the triangle pattern has occurred after a period of consolidation below the $6.25 support level. This suggests that bulls are now in control of the DOT market and will likely push prices higher soon.
The Polkadot price is currently trading at $6.43 and is facing resistance at the $6.50 level. If the bulls can push the price above this resistance, we could see an increase in buying pressure that could lead to a move towards the $7.00 level. On the other hand, if the bulls fail to push prices above $6.50, we could see a pullback towards the $6.25 support level.
DOT/USD 1-day price chart: Bullish rally takes price above $6.43 fence
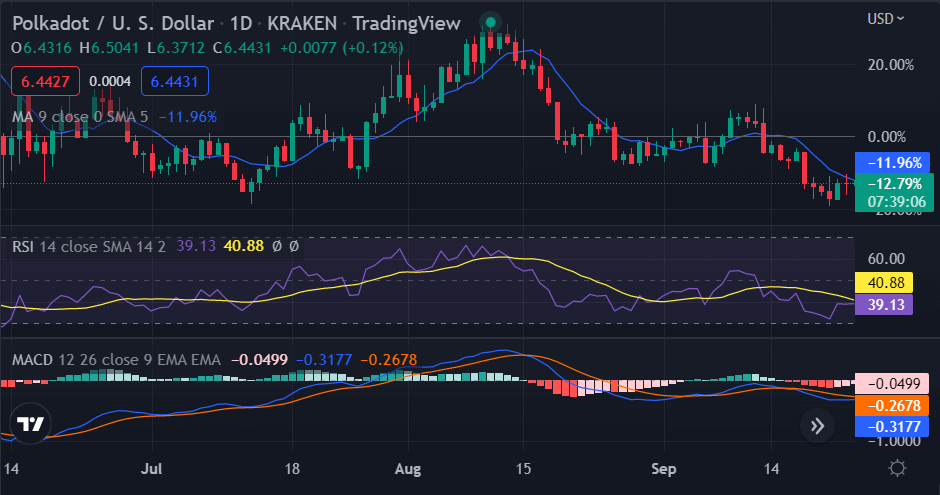
The one-day Polkadot price analysis is dictating that a rise in price has taken place in the last 24 hours. The circumstances have been going extremely favorable for the bulls as they managed to push DOT prices beyond the $6.25 support and close the day above it. The cryptocurrency is now trading at $6.43, which is 3% up from its opening price today.

The moving average (MA) value in the one-day price chart is at the $6.40 level, which is above the current market price. This suggests that there is still some bullishness remaining in the market and that prices could continue to rise in the short term. In addition, the MACD indicator is close to crossing over into positive territory, which also points to a possible bullish trend in the DOT market. The Relative Strength Index (RSI) score has improved up to the 40.88 level, which suggests that there is some upward momentum present in the market.
Polkadot price analysis 4-hour price analysis: Recent developments
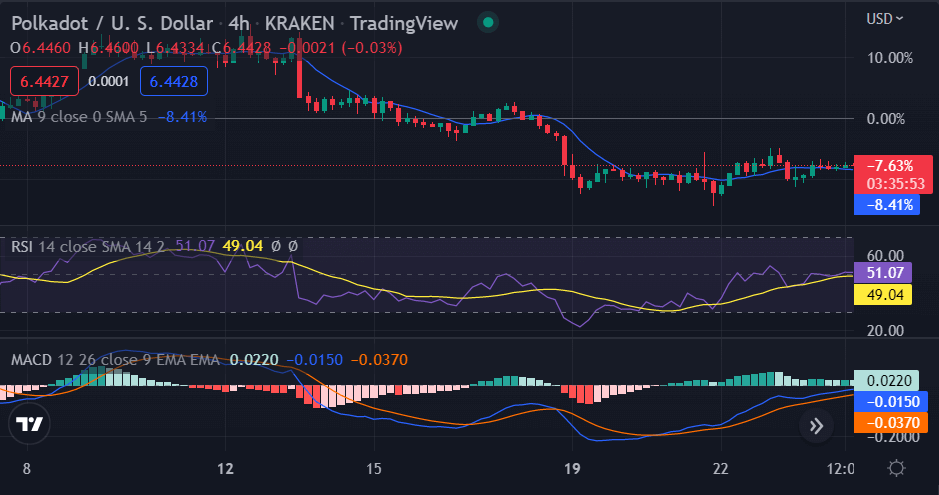
The hourly Polkadot price analysis is currently in a bullish trend as the cryptocurrency has managed to break out of a descending triangle pattern. The breakout from the triangle pattern occurred after a period of consolidation below the $6.25 level, which suggests that the bulls have now gained control of the market.

The moving averages on the 4-hour chart are all in bullish territory, which suggests that prices could continue to rise in the short term. In addition, the MACD indicator has crossed into positive territory, which is another bullish sign. The RSI score is currently at the 49.04 level, which suggests that there is some upward momentum present in the market.
Polkadot price analysis conclusion
To conclude, Polkadot’s price analysis shows that the market is in a strong uptrend as prices continue to make higher highs and higher lows. Bears have been losing control of the market as buyers push prices higher. The market is expected to remain volatile in the near term as the market establishes a new trading range. The investors are advised to keep an eye on the $6.50 resistance level as a breakout above this level could lead to further gains.
Disclaimer. The information provided is not trading advice. Cryptopolitan.com holds no liability for any investments made based on the information provided on this page. We strongly recommend independent research and/or consultation with a qualified professional before making any investment decisions.
1
0


