NEM price shoots up 45% in 24 hours
1y ago
bullish:
0
bearish:
1
Share

NEM (XEM) has experienced a significant surge in its trading price over the past 24 hours, with a 45.70% increase to a current value of $0.059643494140.
NEM (XEM) price surges 45% in 24 Hours
The trend has been ongoing for the past week, as the price has increased by 44.40%.
Over the past 24 hours, the trading volume has reached $458,320,094, indicating a growing interest in NEM among investors. NEM’s current market capitalization stands at $532,308,072, based on its circulating supply of 9 billion XEM. This surge in price may signal a positive outlook for NEM and its prospects.
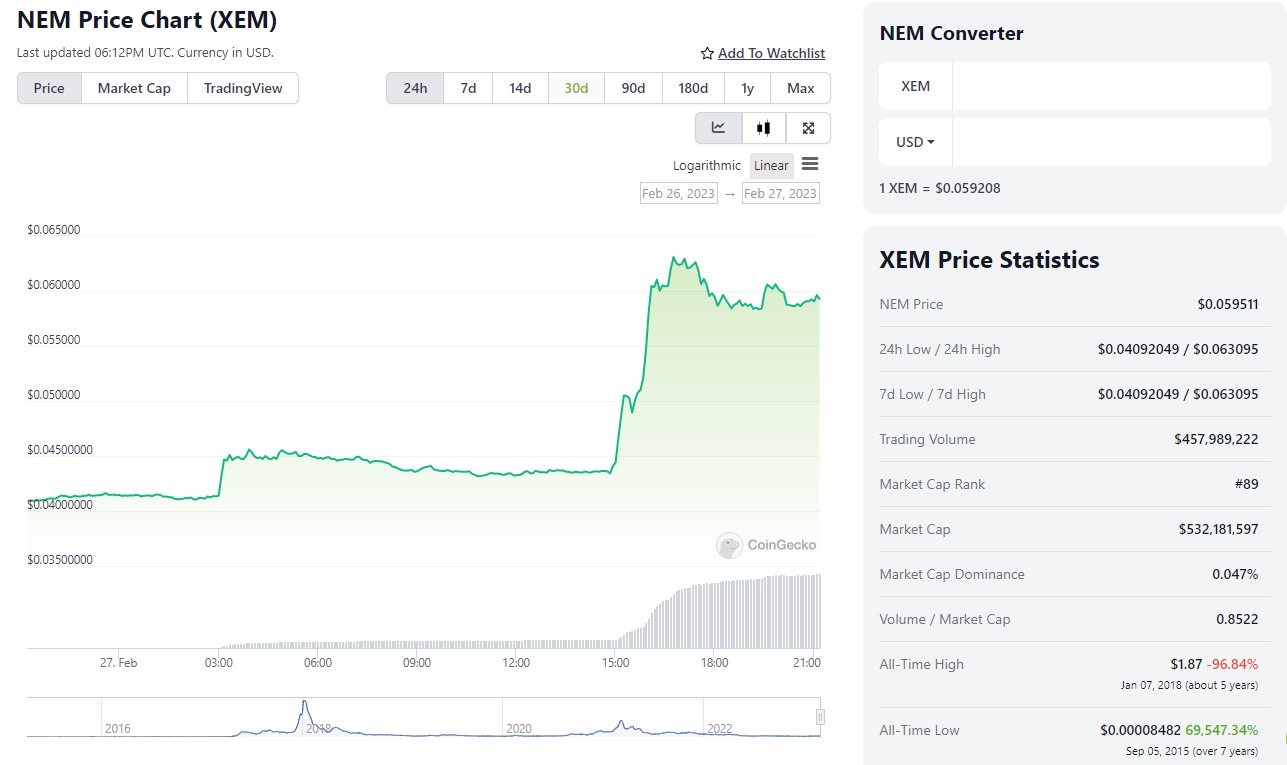
NEM(XEM) emerged among the day’s top gainers, reaching a staggering 45% increase in just 24 hrs.
The coin has been the debate of the day, with many traders anticipating a further surge in the price of XEM. It is not yet clear as to what was the cause of the surge, but according to the NEM team, they are currently investigating a chain halt that occurred at block height 4129631.
NEM (XEM) has demonstrated exceptional performance in the past 7 days, with a significant price surge of 44.40%.
The remarkable growth has surpassed the global cryptocurrency market, which has witnessed a decline of -4.70% during the same period. XEM’s performance has generated a positive sentiment among the community, with over 79% of users expressing confidence in NEM (XEM) today, indicating a bullish outlook.
NEM (XEM) technical price analysis
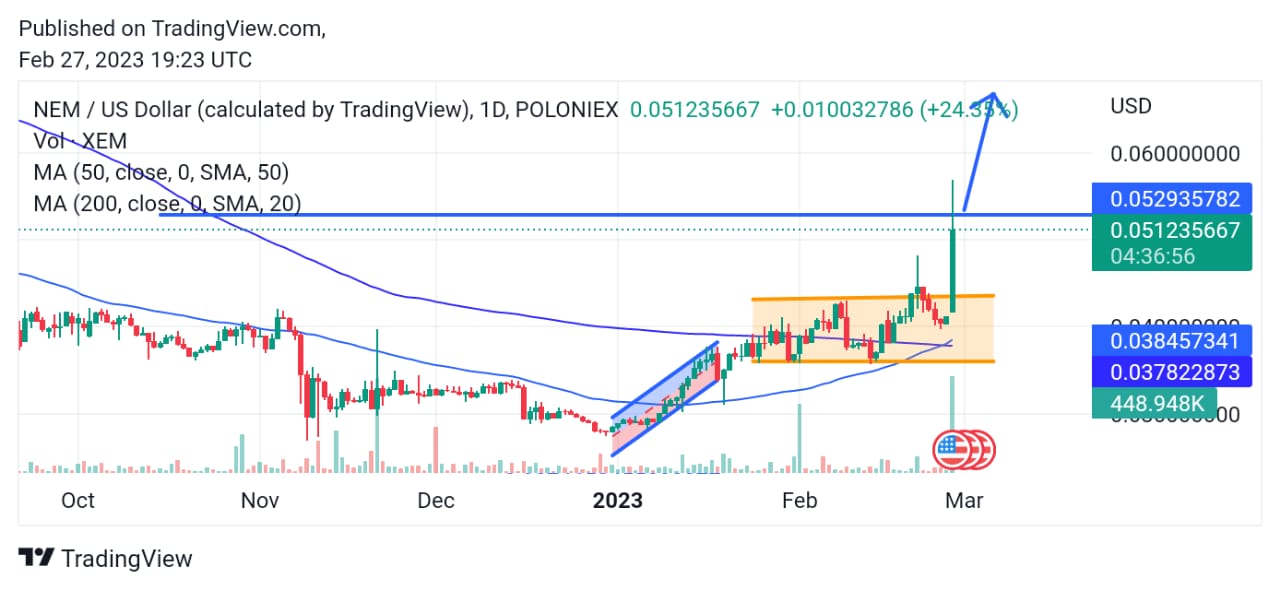
The price of the NEM token shows a decline from mid-October to the beginning of 2023. The token began on a bull rally that lasted almost two months. The token has, however, hit the resistance level and is currently in a retrace along the daily buy candle.
The daily long green candle shot up and broke above the consolidation zone. However, all indicators are bullish on the NEM token.
The 50-day and 200-day moving averages are on the crossover, indicating that the buyer is getting ready and warming up for the second leg of the market price. Furthermore, the Relative Strength Index is trading above the 50 level, indicating signs of a further bull run above the resistance level.
1y ago
bullish:
0
bearish:
1
Share

 Manage all your crypto, NFT and DeFi from one place
Securely connect the portfolio you’re using to start.

bullish:
1
bearish:
0


