Polkadot price analysis: Bearish momentum degrades DOT price to $5.85
1y ago
bullish:
0
bearish:
0
Share

The Polkadot price analysis is showing a negative sentiment in the market. The price has dropped from a high of $6.11 to its current value of $5.85. This represents a decrease of 2.89 percent within the last 24 hours as more investors start to turn bearish on digital assets.
The current trend, if it continues to remain bearish, could lead to the DOT falling below the $5.77 support level. The resistance level for the DOT is set at $6.11, with a break above this level bringing bullish sentiment back into the market. However, if the bears can maintain control and push the price lower, then it could lead to more downside pressure on the DOT price.
Polkadot price analysis 1-day price chart: DOT price keeps hovering in the $5.85 range
The 1-day price chart for Polkadot price analysis shows a decrease in the DOT price value that has been observed today. There have been some bullish efforts in the past week as well, as there are some green candlesticks visible as well, but overall the coin has been maintaining its price level near the same level. The current market sentiment for Polkadot is quite bearish, with some analysts also predicting more downside pressure in the days to come.

The Bollinger Bands are currently squeezed together, with the upper band at $6.67 and the lower band at $5.37. As the price continues to move sideways, the Bollinger Bands could expand or contract, depending on which way the market moves next. The Relative Strength Index (RSI) is currently at a neutral level of 45.40 and is not providing much insight into the market sentiment. The moving average value is at $6.13, indicating that the price has been stable here for some time.
Polkadot price analysis: Recent developments and further technical indications
The 4-hour Polkadot price analysis shows that the price function is in a phase of reversing upwards at the moment. The price breakout was downwards today, after a small recovery by the bulls at the end of the previous trading session, as the selling pressure appeared again just above the current price level. Currently, the price has moved below yesterday’s closing value of $6.10, which shows a further loss.
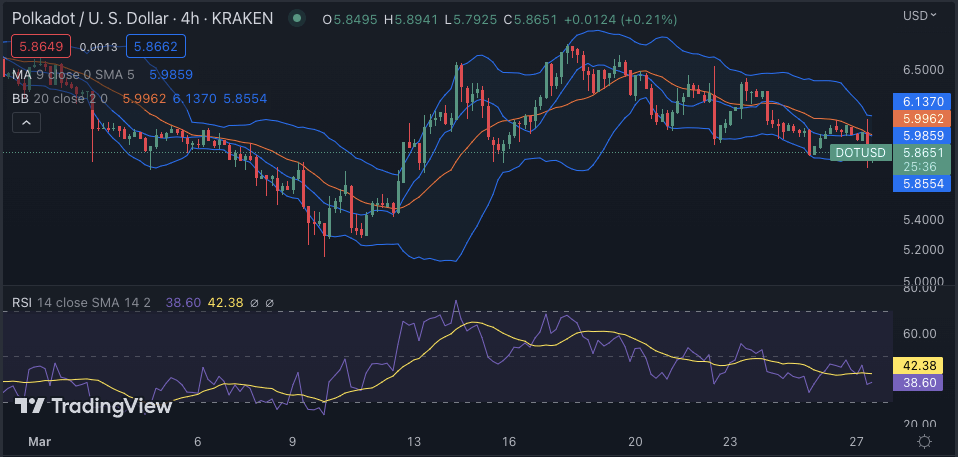
The Bollinger Bands in the 4-hour chart are in bearish expansion mode, with the upper band at $6.13 and the lower band at $5.85. The RSI (Relative Strength Index) is currently in neutral territory at 38.60, indicating that there is no strong trend present in the market right now. The moving average value is at $5.98, indicating that the price has been quite stable here for some time now.
Polkadot price analysis conclusion
The Polkadot price analysis is reporting that bearish dominance has been seen today as well. The price levels have dropped to $5.85, but DOT has only recently found support, which will be tested in the coming hours. However, we don’t expect a major shift in the price levels for today.
1y ago
bullish:
0
bearish:
0
Share

 Manage all your crypto, NFT and DeFi from one place
Securely connect the portfolio you’re using to start.

bullish:
0
bearish:
0


