Cardano Price Analysis: Downfall continues as bulls are crushed under bearish pressure
0
1

Cardano price analysis reveals that the cryptocurrency has been facing a downward trend today as the bears are in control of the market and are likely to maintain their momentum. The bears have caused a decrease in the price up to the $0.318 level.
Cardano is ranked number 9 in terms of cryptocurrency, putting its total market cap at roughly $10,954,783,771.ADA has seen a decrease in its total 24-hour trading volume as the figure now stands at $174,514,763 which is a 13.8% drop over the last day. The price of Cardano is nearer to its 24-hour high of $0.3219, with its 24-hour low at $0.3122.
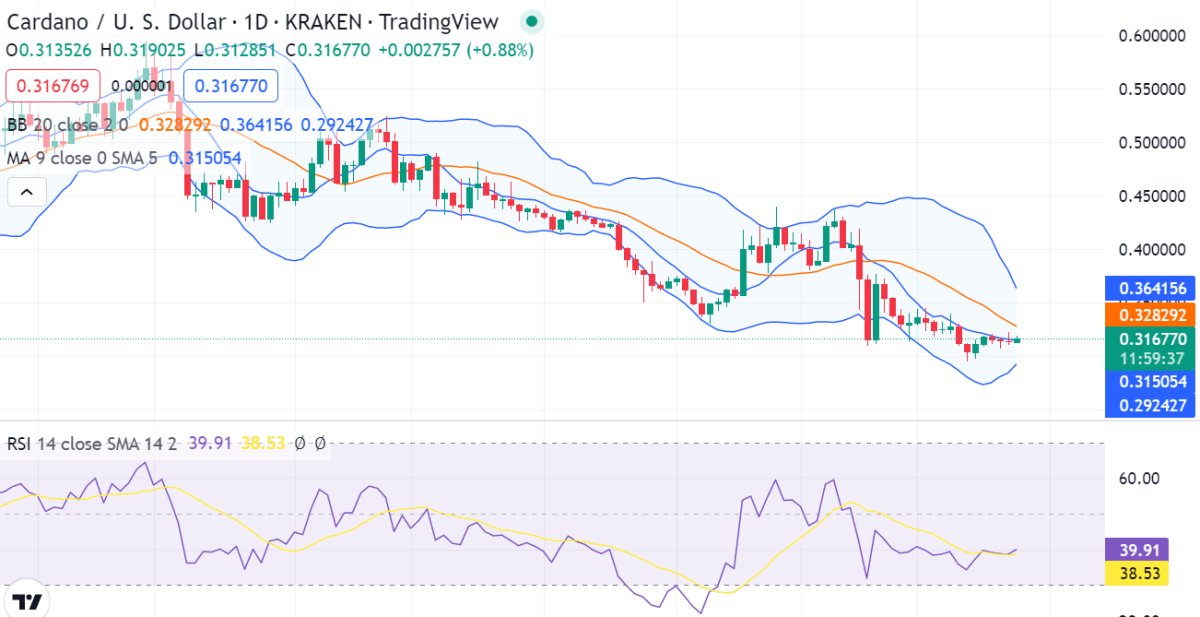
ADA/USD 1-day price chart: Bears in control as Cardano prices fail to breakout
The 1-day Cardano price analysis shows that the ADA/USD has been on a downtrend last 24 hours. The next few hours of trading are crucial for the market as the market is expected to make a move out of the recent consolidation. The market is expected to break out to the upside or downside in the near term. The bears are pulling down the price levels and are still succeeding in maintaining it as the price has gone down to $0.318.

The Relative Strength Index (RSI) is currently at 38.53, indicating that the bears are in control of the market at this time while the Bollinger bands is increasing, suggesting that further downtrends are taking place as the volatility increases. The upper band of the Bollinger bands indicator is touching the $0.364 point, whereas their lower band is present at a $0.292 margin. The recent defeat has marked the price below the moving average (MA) level, i.e., $0.3150 as well.
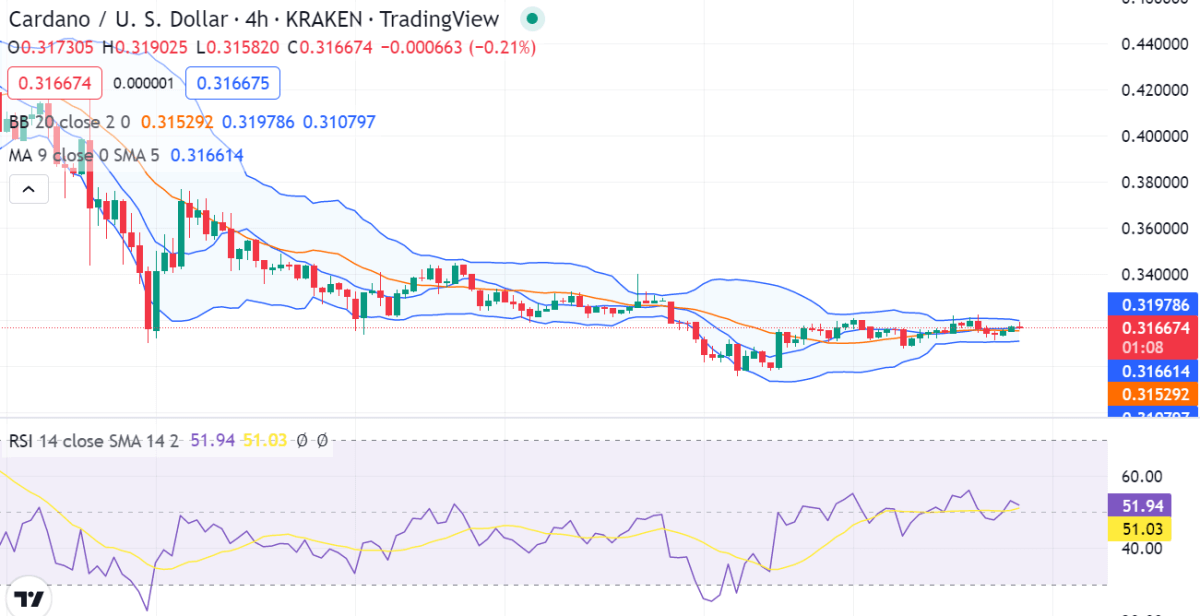
4-hour Cardano price analysis: Latest developments
The 4-hour Cardano price analysis confirms that a bearish trend has been at its peak. The bears have maintained their lead quite efficiently by bringing the price down to the $0.318 level. The price might move towards a new low, and the bearish momentum seems to be intensifying every hour.

The moving average is still quite high and is settled at the $0.3166 position for now. The volatility is low as the upper Bollinger band has moved to the $0.3107position, whereas the lower Bollinger band is at $0.3197. The Relative Strength Index (RSI) for ADA/USD is currently at 51.03, which reveals that the market is neither oversold nor overbought.
Cardano price analysis
Based on the current Cardano price analysis, it is evident that the bearish momentum is strong and has seized control of the market. The bulls have been crushed under massive selling pressure in today’s trading session, and a new low looks imminent. The trend line has also been breached to signal further downward movement in ADA prices.
Disclaimer. The information provided is not trading advice. Cryptopolitan.com holds no liability for any investments made based on the information provided on this page. We strongly recommend independent research and/or consultation with a qualified professional before making any investment decisions.
0
1


