Ethereum price analysis: ETH Stumbles at $1,777, after a bearish outlook
1y ago
bullish:
1
bearish:
0
Share

The Ethereum price analysis shows a bearish outlook as the token has broken below the $1,800 level. The day started with selling pressure building up in the market, and the price dropped from $1,827 to $1,777. The sell-off accelerated further as support failed to hold the levels, and ETH/USD dropped below the $1,790 level.
The immediate support for Ethereum is at the $1,770 level. If this fails to hold the price then ETH will likely drop toward the next major support at the $1,700 level. On the upside, the resistance for Ethereum is at the $1,827 level. If this holds then a minor correction will take place and ETH/USD may rise toward the next major resistance at $1,863.
The bearish momentum is overwhelming as buyers are backing off, contributing to the decline. The downward pressure seems to be extending for the remainder of the day, and the price may go further down than the current price level.
Ethereum price analysis 24-hour chart: ETH trades below $1,800 as selling pressure mount
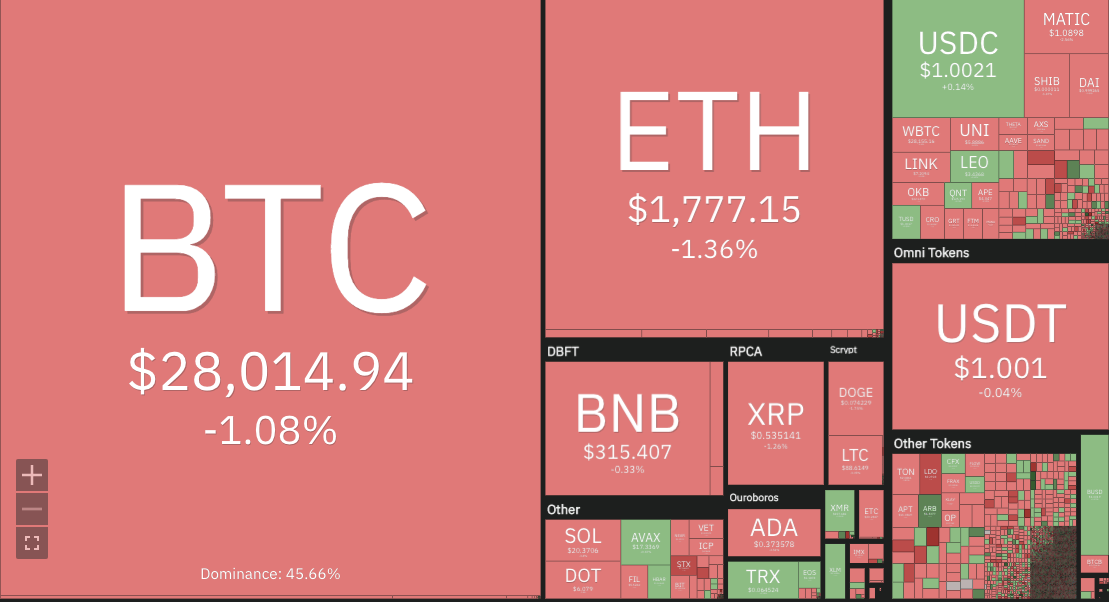
The 24-hour chart confirms the bearish outlook, as ETH/USD trades below the $1,800 level. The token is currently trading at $1,795 and has formed a bearish pattern with a decrease of 1.36 percent in the last 24 hours. The 24-hour trading volume for the ETH token is currently standing at $9.34 billion, while the market cap is at $218 billion.
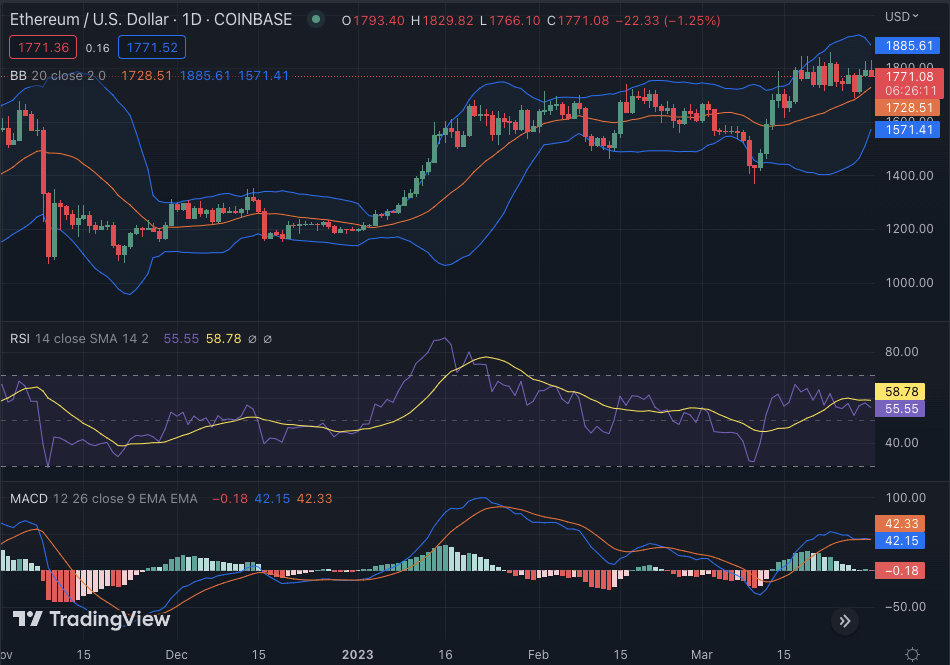
The MACD line has gone below the signal line, indicating a bearish trend in the market. The Relative Strength Index is near the oversold region at 55.55, which suggests that the selling pressure will continue to remain in effect. The Bollinger bands in the daily chart are converging, indicating that the price is likely to remain range-bound. The upper Bollinger band is at $1,885 and the lower band is at $1,571.
Ethereum price analysis: Recent developments and further technical indications
The hourly Ethereum price analysis confirms a downward trend for the market. The price function has been downwards since early today. The previous day the bullish momentum was able to push the price up for a brief period of time, however, it could not sustain that level. The red candlestick in the hourly chart further confirms that the bearish momentum has taken over. The four-hour moving average indicator is currently at $1,790 and the 20 SMA and 50 SMA are both declining too.
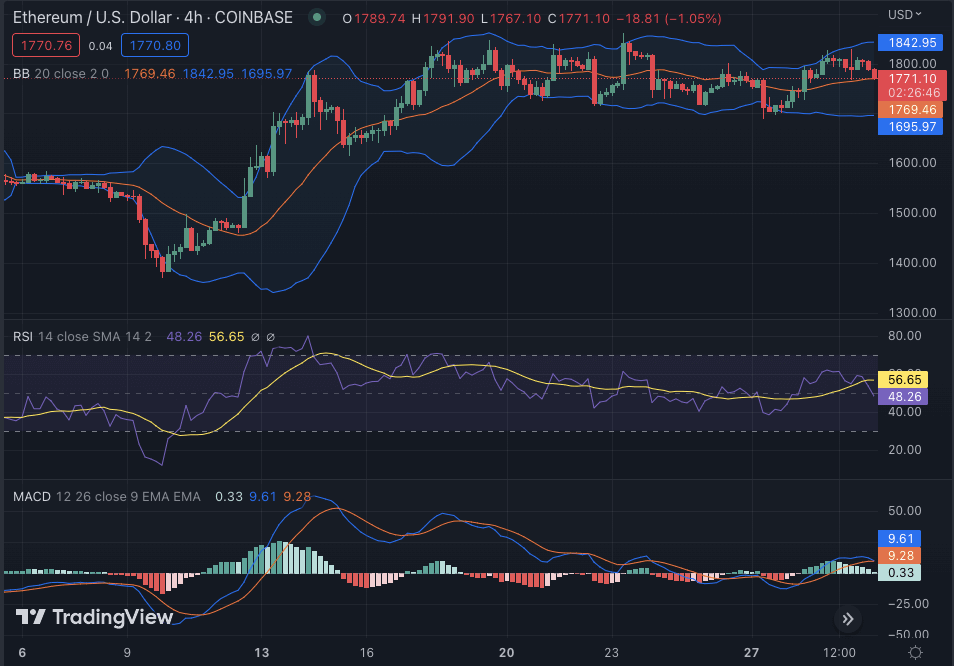
The hourly Bollinger bands are contracting, indicating that the current range is likely to persist. The upper band is at $1,842 which may act as the resistance line and the lower band is at $1,695 which may act as the support if the bearish trend continues. The Relative Strength Index is presently at 48.26 which confirms that the bearish pressure will remain in effect. The Moving Average Convergence Divergence line has gone below the signal line, confirming that the bear market is here to stay. The histogram values are also diminishing which further confirms that the bearish outlook is here to stay.
Ethereum price analysis conclusion
Overall, Ethereum price analysis indicates a bearish market trend in the near term. The token is currently trading below the $1,800 level and the bearish momentum seems to be increasing. The support for ETH/USD is present at the $1,770 level and resistance is located around the $1,827 level. If this persists then a further decline may take place in the coming days and Ethereum may drop to the next major support at the $1,700 level. The bearish pressure is dominating and investors should be cautious before entering into any positions.
While waiting for Ethereum to move further, see our Price Predictions on XDC, Cardano, and Curve.
1y ago
bullish:
1
bearish:
0
Share


 Manage all your crypto, NFT and DeFi from one place
Securely connect the portfolio you’re using to start.

bullish:
0
bearish:
0

bullish:
0
bearish:
0

bullish:
0
bearish:
0

bullish:
0
bearish:
0