Ethereum price analysis: ETH holds steady above $1,700 despite anticipation of Fed Rate Hike
1y ago
bullish:
2
bearish:
0
Share

Ethereum price analysis for today reveals ETH has been trading inside a narrow range above $1,700. Ethereum’s price has been fluctuating between $1,733.89 and a high of $1,821.46. Ethereum is trading at $1,726, down 3.70% from the 24-hour high.
The cryptocurrency is being driven by market sentiment as traders await further guidance from the Federal Reserve, which meets later this week to decide on its latest policy and outlook. The U.S. central bank could raise interest rates as inflationary pressures build in the economy, something that could put a damper on Ethereum’s price.
Ethereum price analysis on a daily chart: ETH consolidates above the $1,700 mark
The Ethereum price analysis on a daily ETH chart shows the cryptocurrency has been consolidating within a narrow range for the past few days. The support level is around $1,733.89, where the price has found some footing after hitting an intraday low of $1,732.87.
Meanwhile, Ethereum’s relative strength index (RSI) is currently hovering at the 50 mark, indicating that the coin is trading in neutral territory.
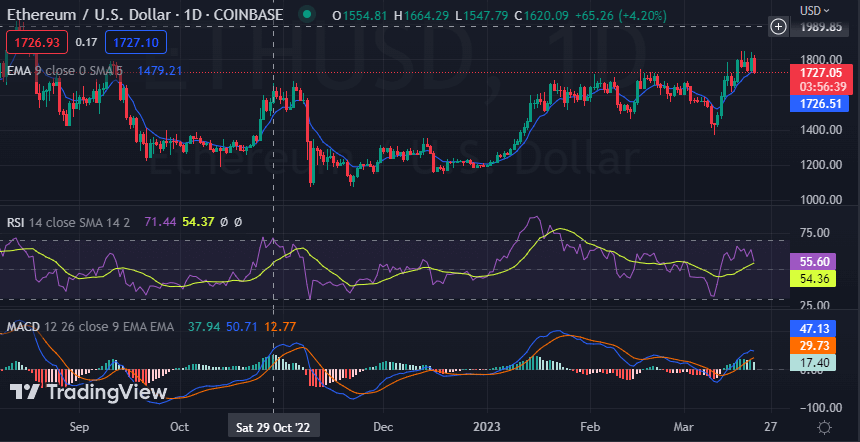
Ethereum has formed a descending triangle pattern on the chart, which could lead to an eventual breakdown if the bears gain control. ETH price has faced a minor pullback near the Fibonacci 0.786 retracement level, which could act as a support in the near term. The bearish sentiment painted by the popular momentum oscillators could cause the Ethereum price to move lower and retest the SMA 50 support at $1,716.
Ethereum price analysis on a 4-hour: ETH retraces from the intraday high
Ethereum’s 4-hour chart paints a bearish picture, as ETH briefly touched the $1,821.46 level before retracing lower. The MACD is trending in the bearish zone, while the RSI has dropped to 43.18, indicating that bears have taken control of the market. The cryptocurrency has formed a bearish flag pattern on the 4-hour chart, which could lead to further downside movement if it fails to break above the upper trendline. The EMA50 and EMA100 resistances may act as strong barriers at $1,728.02 and $1,728.49, respectively.
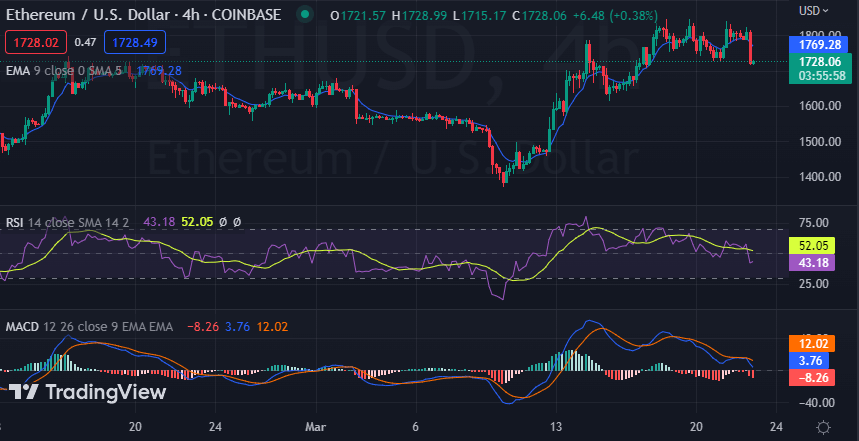
The Fibonacci retracement levels also point towards more downside movement, as ETH could drop to the 61.8% level at $1,706.47 in the near term. In a bullish scenario, Ethereum could break above the upper trendline of the Fibonacci and form a bullish flag pattern.
Ethereum price analysis conclusion
Ethereum’s current price analysis suggests that the coin is likely to move lower in the near term. The bearish momentum painted by the technical indicators could push ETH to retest the $1,700 level. Ethereum is still trading within a bullish zone and is likely to remain supported above the $1,700 mark in the near term. The key resistance levels are around $1,750 and $1,800 if the bulls attempt to break higher. If the bears gain control, ETH could move lower toward the $1,700 level.
1y ago
bullish:
2
bearish:
0
Share

 Manage all your crypto, NFT and DeFi from one place
Securely connect the portfolio you’re using to start.

bullish:
0
bearish:
0

bullish:
0
bearish:
0

bullish:
0
bearish:
0

bullish:
0
bearish:
0