EOS, MATIC, Uniswap Price Analysis: 31 July
3y ago
bullish:
2
bearish:
0
Share

Bitcoin broke out of its consolidation phase, and again went above its $40,000 mark. Whereas altcoins mostly stayed consolidated. EOS rose only by 2%, whereas MATIC showed no movement at all. The EOS chart showed fewer signs of volatility, MATIC flashed signs of a possible price breakout and UNI mostly emanated bullish signals on its 4-hour technical charts.
EOS
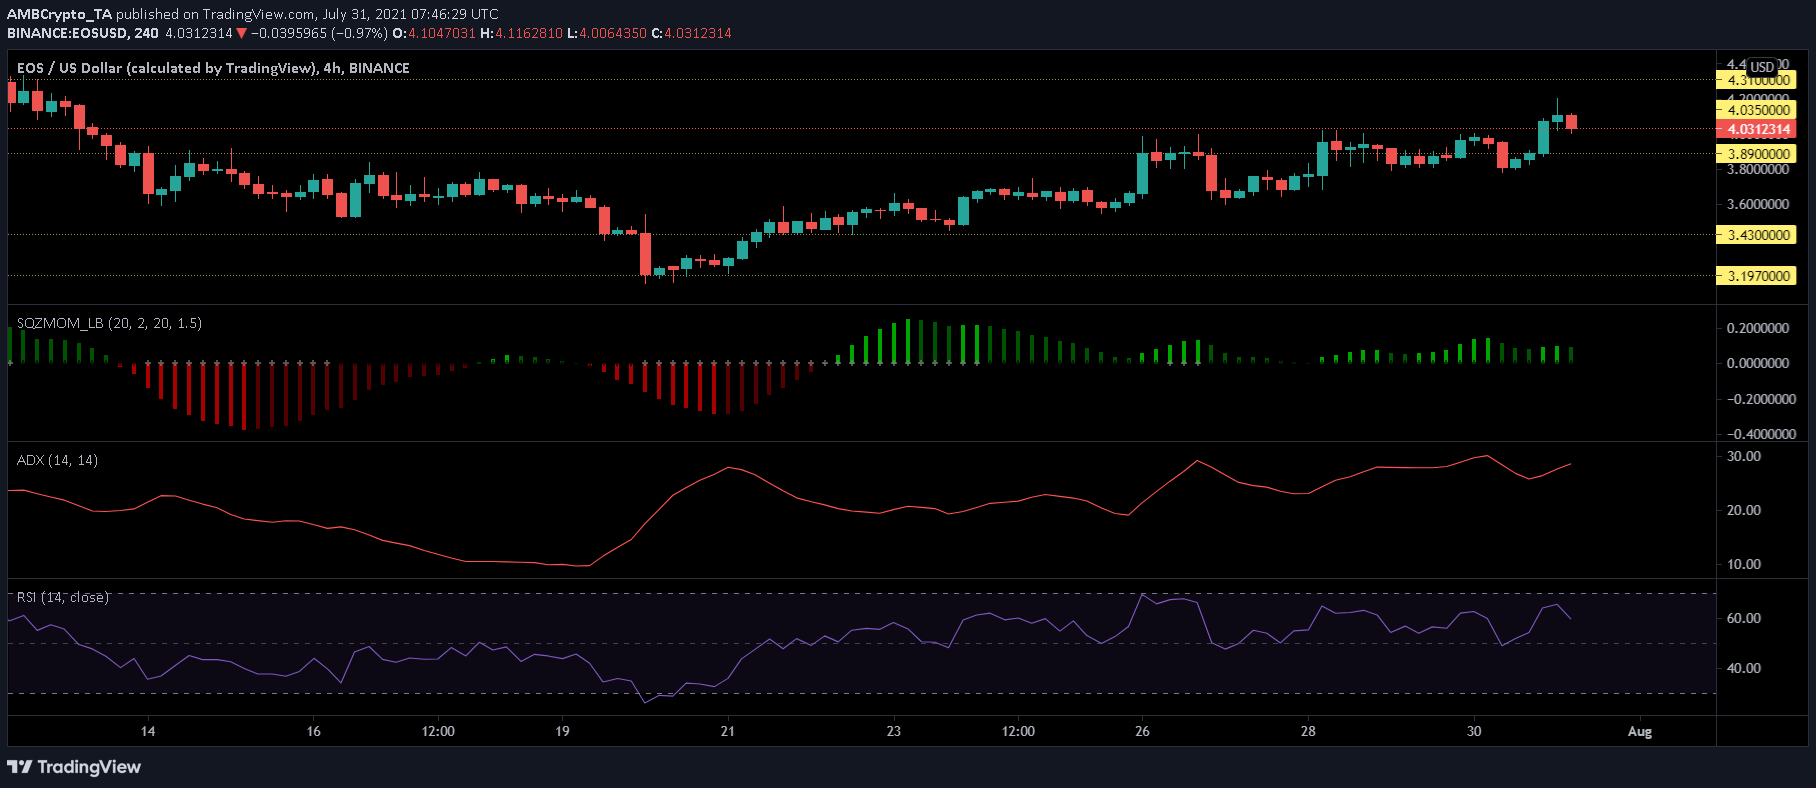
EOS/USD, Trading View
Post minor gains, EOS prices stood at $4.03 at press time. Its market capitalization also rose slightly, by 1.77%. The alt was trading in the red despite the gain observed on the daily frame. Its upward movement since July 21 was steady with a few halts in between.
The market was seen a squeeze as depicted by the Squeeze Momentum Indicator. The same indicated low volatility. As the Average Directional Index neared the 30-mark, it could be inferred that the market was regaining strength. Hence, a sharp fall in prices might not be expected.
Conversely, however, buying pressure dipped on the Relative Strength Index as prices have not shown a considerable increase over the last 24 hours.
MATIC
MATIC/USD, TradingView
At the time of writing MATIC was priced at $1.05. This marked a 5% increase in prices over the last 24 hours. MATIC is yet to recover the losses it incurred despite the price corrections it witnessed in the month of July. The alt is one of the least gainers over the weekly time frame as it has only seen an increase of 9.6%.
The token had struggled to break through its $1.03 resistance for a while and it only managed to do so on July 27. As prices have not moved upwards since. It could possibly fall below the $1 mark again. On the upside, if prices do break through, the next resistance lies at $1.06. On the other hand, if prices keep hovering in the same region, it’ll fall to its $0.94 support level.
From the technical outlook, a price breakout seems likely. The Bollinger Bands have tightened indicating low volatility along with chances of a possible breakout. Parabolic SAR has shown a presence of uptrend, which means in case of a likely breakout, prices might move north.
Chaikin Money Flow, however, showed a dip in capital inflows at press time as MATIC hasn’t given promising returns on investment lately.
Uniswap (UNI)
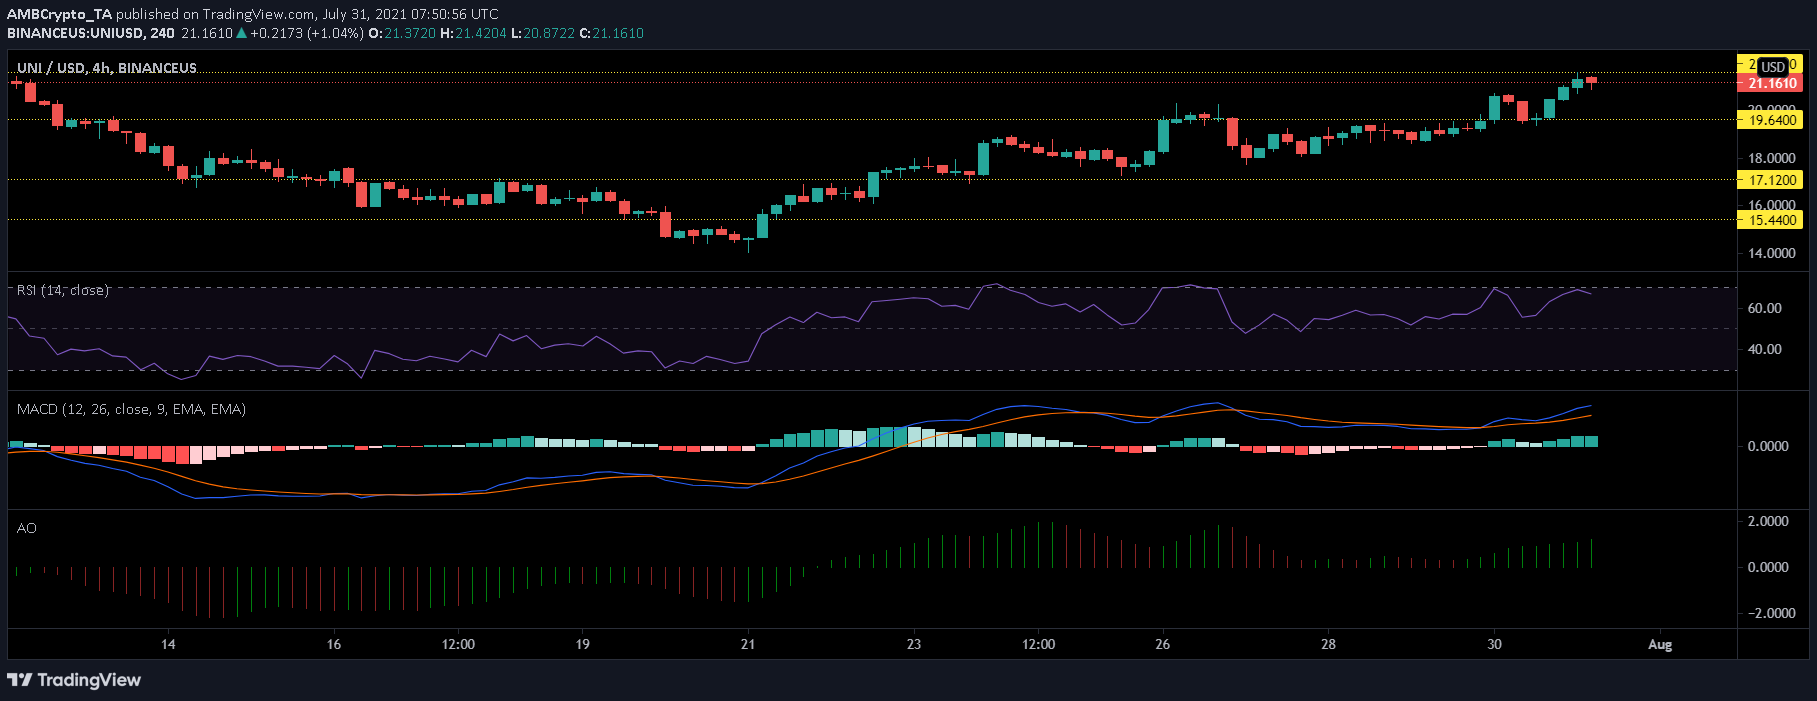
UNI/USD, Trading View
Uniswap’s price movement depicts consolidation as the coin moved between the price levels of $19.60 and $21.60. At press time, UNI was valued at $21.16. It tried to test the resistance levels of $21.60 over the last trading sessions however, it failed to move above it.
If prices keep hovering in the same region, UNI could fall in value and rest on the $19.60 support level. If, however, the prices manage to push up, it could test its immediate resistance and trade above that level.
The technical outlook of UNI seems to be bullish as the MACD indicator after picturing a bullish crossover on July 30, flashed green histograms growing in size. Awesome Oscillator also validated the same by picturing green signal bars at press time.
Relative Strength Index displayed a slight drop in buying pressure, however, the indicator, despite noting a decrease in the number of buyers, painted an overall bullish picture.
The post EOS, MATIC, Uniswap Price Analysis: 31 July appeared first on AMBCrypto.
3y ago
bullish:
2
bearish:
0
Share


 Manage all your crypto, NFT and DeFi from one place
Securely connect the portfolio you’re using to start.

bullish:
0
bearish:
0

bullish:
0
bearish:
0

bullish:
0
bearish:
0

bullish:
0
bearish:
0