Binance Coin, WAVES, Uniswap Price Analysis: 03August
3y ago
bullish:
4
bearish:
0
Share

Both Bitcoin and Ethereum reported losses since yesterday and the has halted the upward movements of other altcoins have halted as well. Binance Coin struggled amidst regulatory concerns, the latest being the Malaysia ban. WAVES gently recovered and displayed a sideways movement while UNI was headed to land on its immediate support level.
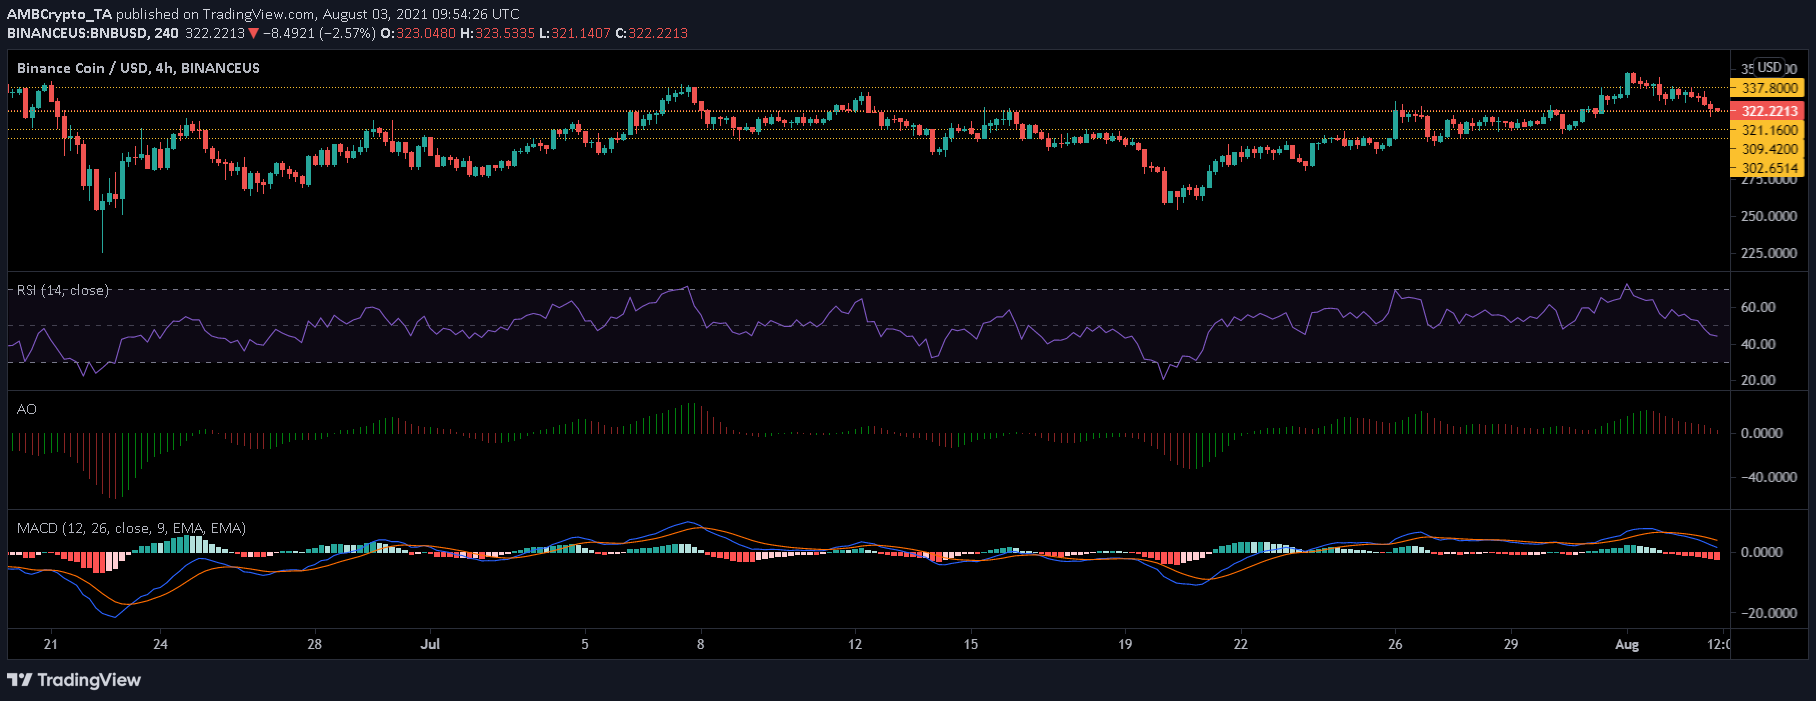
Binance Coin (BNB)
BNB/USD, TradingView
Binance Coin had shot up above its $337 crucial resistance level just two days ago. The broader market sentiment dampened the upward trend as BNB reached out to its $322 support level.
With a further decline, the support region could be spotted at around $309. The recent 3.1% dip forced the Relative Strength Index to plunge through its midline as it dived into the bearish zone.
Other indicators corresponded to the reduced buying pressure as the Awesome Oscillator put forth the idea that a bearish signal was on the rise. MACD too displayed growing red bars on its histogram at press time. If BNB reverses, the resistance level lies at $337.
Last week, Binance was in the news as the Malaysian government took enforcement action against the exchange, cease its operations in the country.
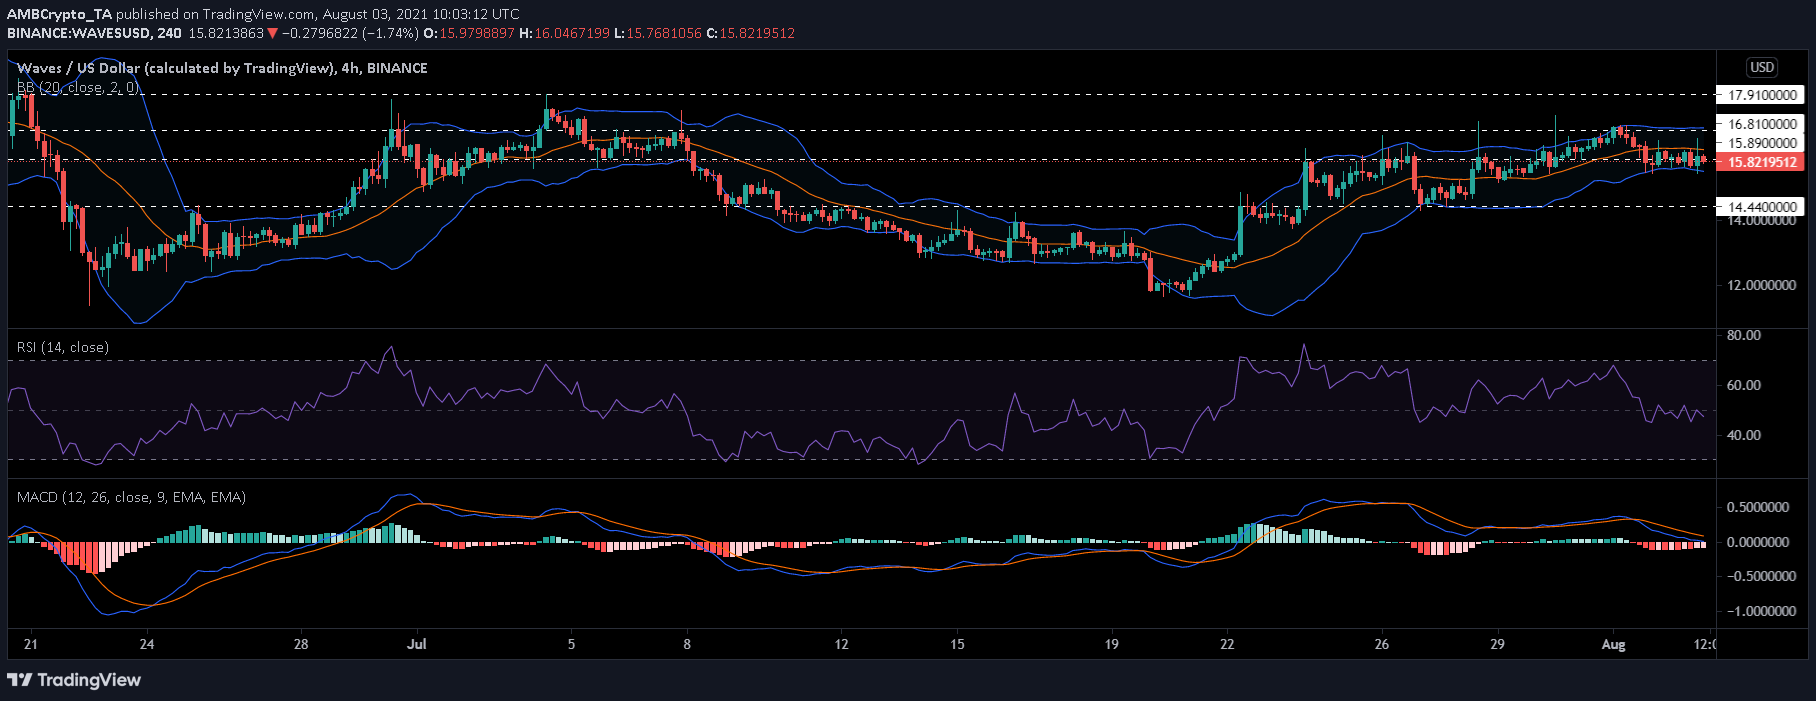
WAVES
WAVES/USD, TradingView
WAVES recovered slightly as it noted a 0.2% increase overnight, and it could be said that the alt depicted lateral movement. The price action remained sandwiched between $16.81 and $15.80. At the time of writing, the coin was priced at $15.82.
As the bears strengthened, the alt could be heading towards the $14.44 support level. On the upside, it would have to test the $16.81 level soon to avoid falling in value further.
Relative Strength Index broke below its centerline as it headed into a bearish zone and MACD showed the presence of red bars on its histogram.
Bollinger Bands stayed parallel with medium divergence, indicating that prices won’t fluctuate too much.
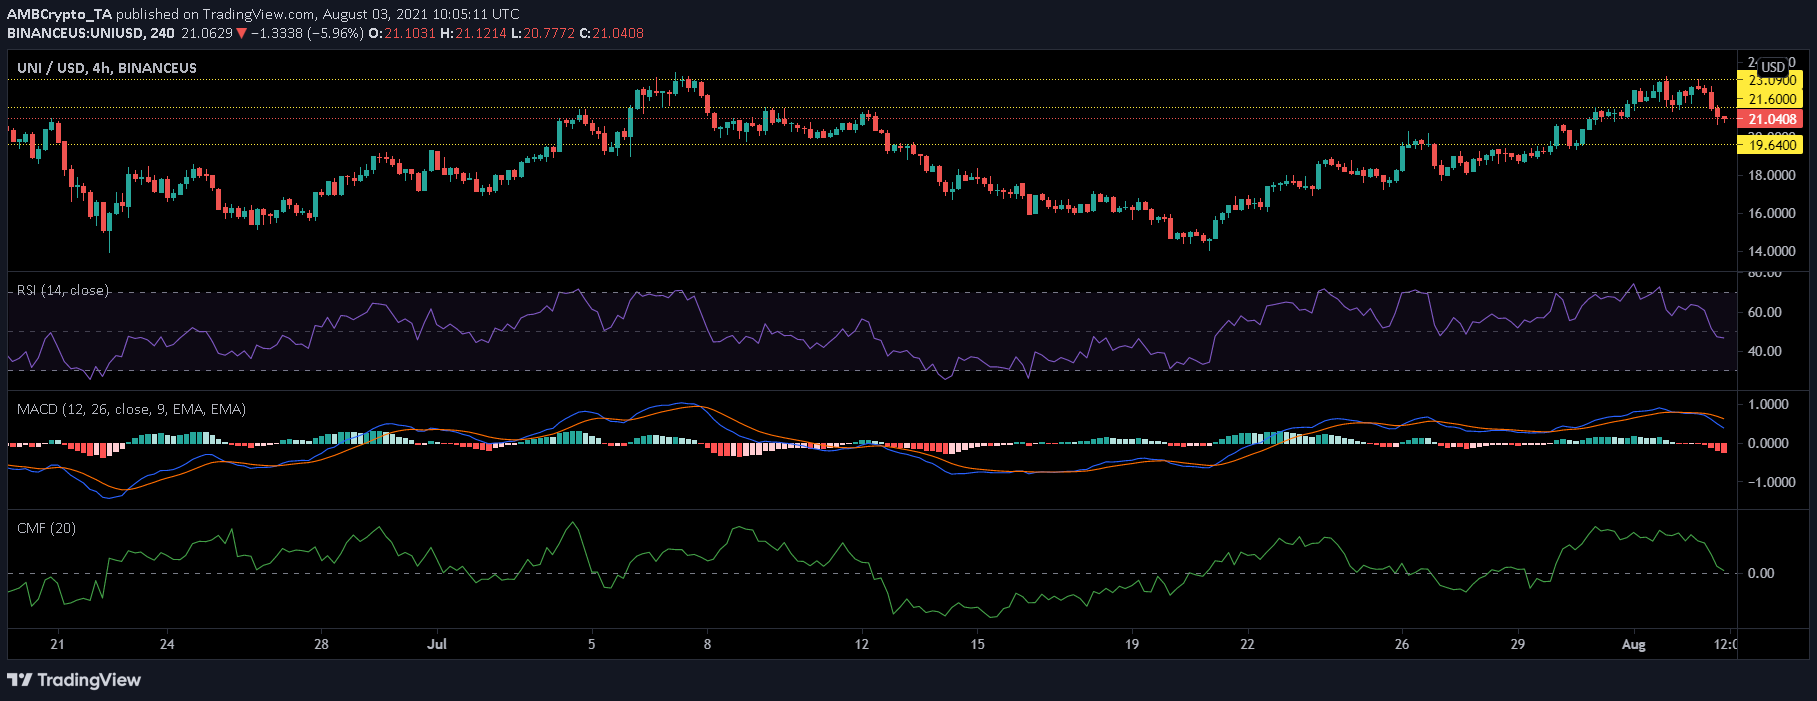
Uniswap (UNI)
UNI/USD, TradingView
UNI was headed towards its support level of $19.60 at press time, as it traded at $21.00. It declined 4.6% over the last 24 hours. All the technical indicators painted to a strong bearish trend for the alt.
It immediate support level was at $19.60. The Relative Strength Index plummeted and fell into the bearish zone after managing to remain bullish since July 21. A bearish crossover on the MACD gave rise to red histograms.
Capital inflows dropped sharply, however, inflows still preceded outflows at press time on the Chaikin Money Flow.
The post Binance Coin, WAVES, Uniswap Price Analysis: 03August appeared first on AMBCrypto.
3y ago
bullish:
4
bearish:
0
Share


 Manage all your crypto, NFT and DeFi from one place
Securely connect the portfolio you’re using to start.

bullish:
0
bearish:
0

bullish:
0
bearish:
0

bullish:
0
bearish:
0

bullish:
0
bearish:
0