XRP, Cardano and Ethereum Price Analysis: July 27
3y ago
bullish:
11
bearish:
1
Share

The global crypto market cap was $1.52 Trillion after a 2.9% decrease over the last day. The market capitalization of major alts dropped too. XRP fell out of the overvalued territory today and buying pressure considerably decreased at press time, while ETH showed signs of volatility.
XRP
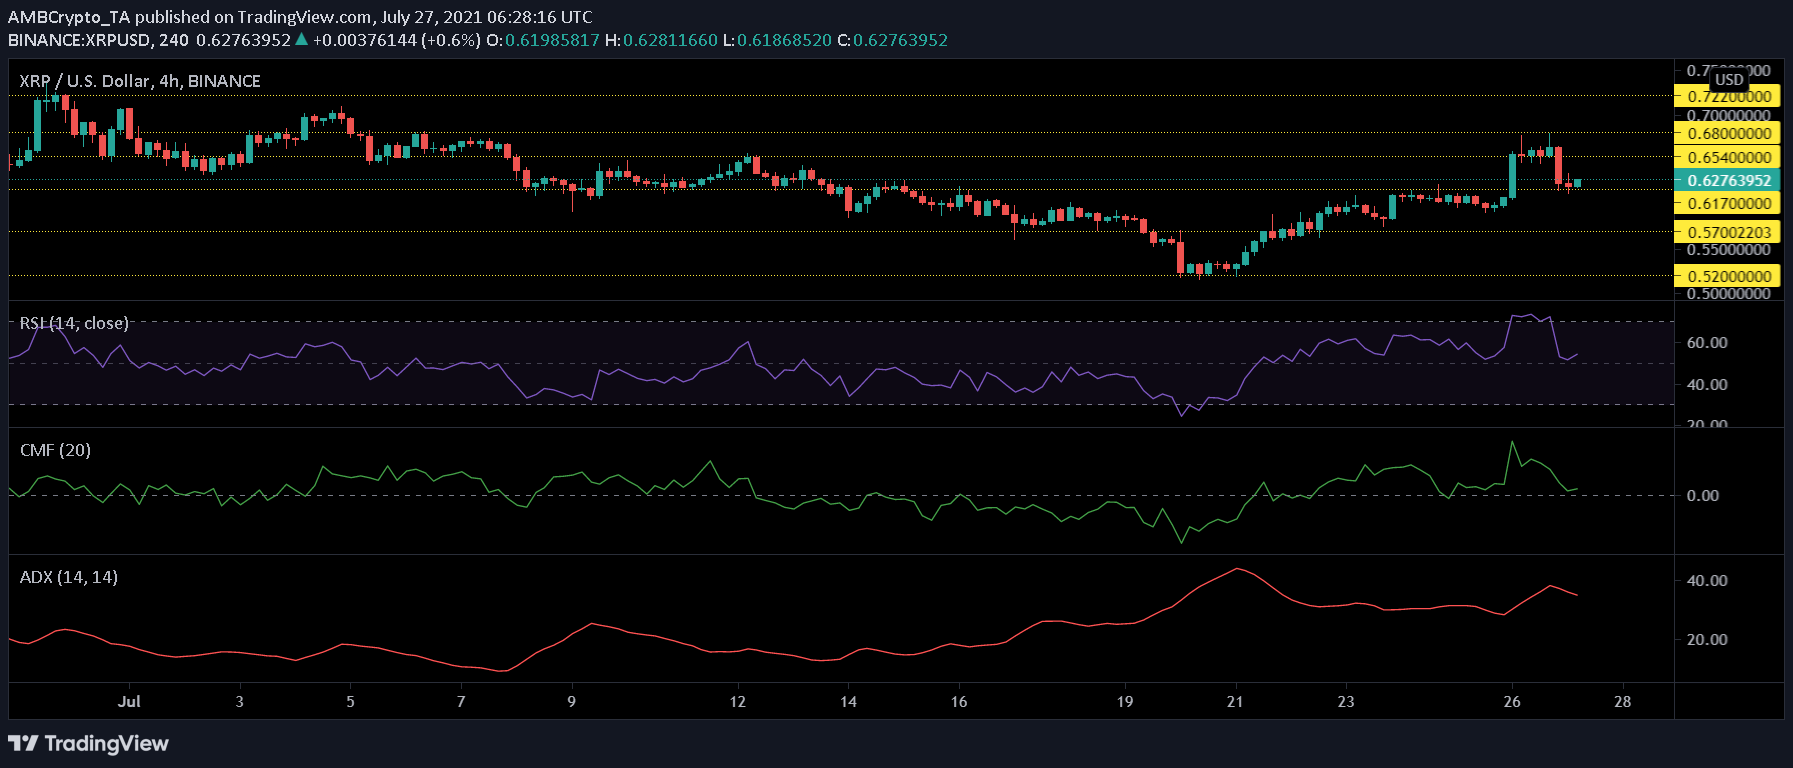
XRP/USD, TradingView
XRP, at press time was trading around $0.62. The coin fell by almost 4% over the last 24 hours and trading volume dipped by 34.76% over the past 24 hours, the dip in trading volume suggested lowered buying pressure as observed from the 4-hour technical analysis charts.
Relative Strength Index pictured a sharp fall straight out of the overbought territory implying that panic selling could have had happened. Chaikin Money Flow also registered an increase in capital outflows at press time.
Average Directional Index moved south as seen at press time; it stood below the 40-mark hinting at the current market weakness owing to a fall in prices.
Cardano
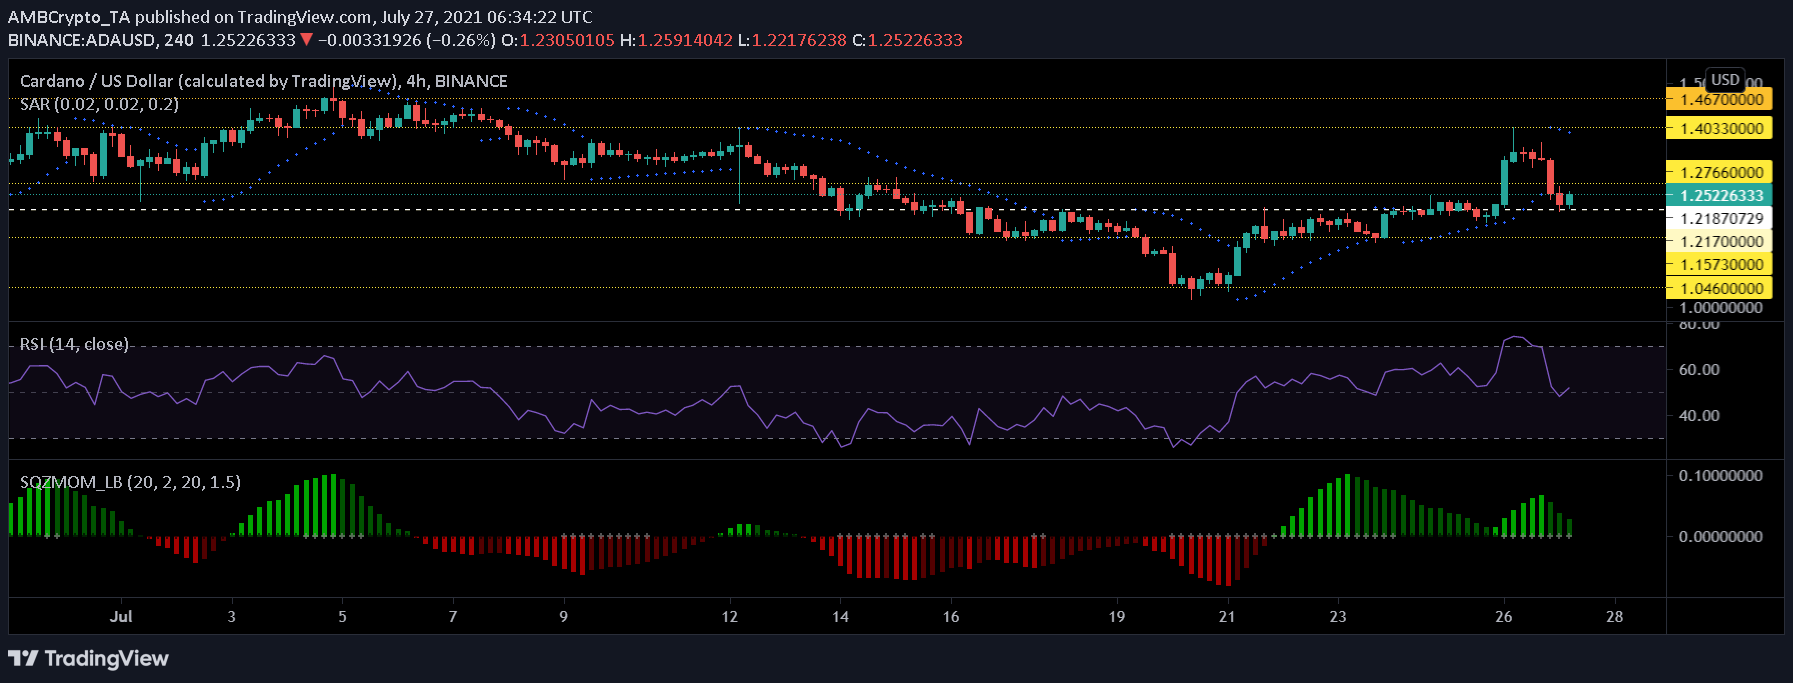
ADA/USD, TradingView
Cardano traded 6.7% lower at $1.25 over 24 hours, over the last week ADA traded 11.7% higher. The coin at its current price was almost 50% down from its all-time high. At press time, ADA was trading in the green with a slight recovery seen on the Relative Strength Index as the uptick noted signified an increase in buying pressure.
If prices retrace further, the support level to watch out for could be at $1.21. Squeeze Momentum Indicator depicted a squeeze release, hinting that market volatility could be anticipated moving forward. The dotted lines of the Parabolic SAR had arranged themselves over the candlesticks, meaning that the price was on a downtrend.
Ethereum
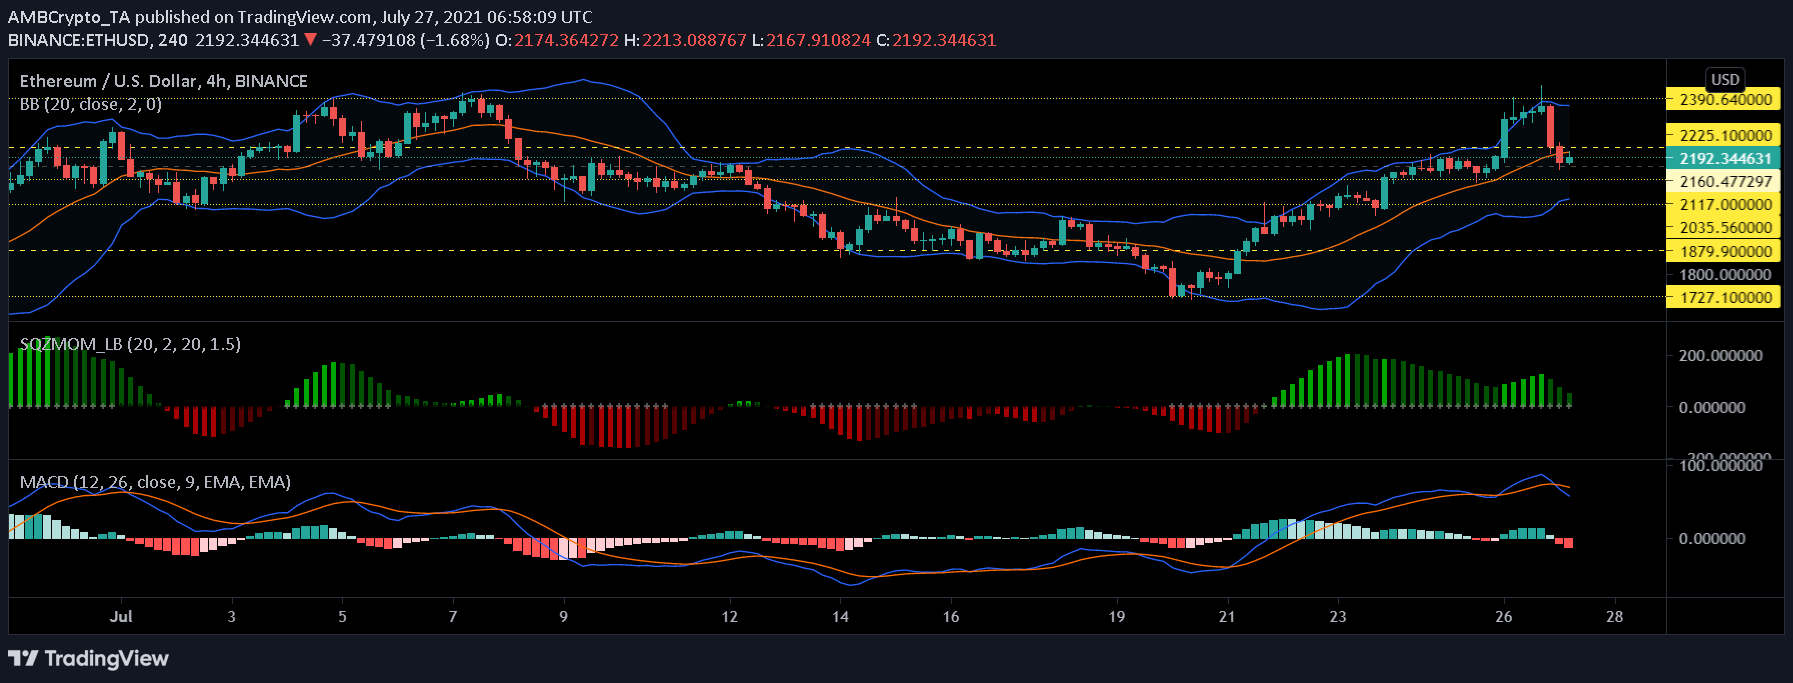
ETH/USD, TradingView
Market capitalization of ETH fell by 4.91% since yesterday. Bollinger Bands showed convergence, which meant despite volatility, no major price movements are expected.
Squeeze Momentum Indicator signalled a squeeze release and an indication of purchasing long. If the prices rose up, the immediate resistance level that it could test would be $2390 and on the flip side, the support level would be $2160 and subsequently $2117.
As the market looked relatively bearish to that of yesterday, MACD flashed a bearish crossover in the early hours of July 27. Ever since the crossover, the red histograms appeared to mark the presence of bears back in the market.
The post XRP, Cardano and Ethereum Price Analysis: July 27 appeared first on AMBCrypto.
3y ago
bullish:
11
bearish:
1
Share


 Manage all your crypto, NFT and DeFi from one place
Securely connect the portfolio you’re using to start.

bullish:
0
bearish:
0

bullish:
0
bearish:
0

bullish:
0
bearish:
0

bullish:
0
bearish:
0