How Polkadot's traders can cash in on a projected retracement
3y ago
bullish:
2
bearish:
0
Share

Disclaimer: The findings of the following analysis are the sole opinions of the writer and should not be taken as investment advice
Polkadot's recovery has been in line with most altcoins in the market that rallied on the back of Bitcoin's most recent rebound from $30,000. Its push from 20 July's low of $10.3 to its press time level of $16.4 highlighted staggering gains of nearly 60% in 11 days. However, a closer look at its daily chart seemed to suggest that the cryptocurrency is set for a retracement.
At the time of writing, DOT was trading at $16.45, up by 11.2% over the last 24 hours.
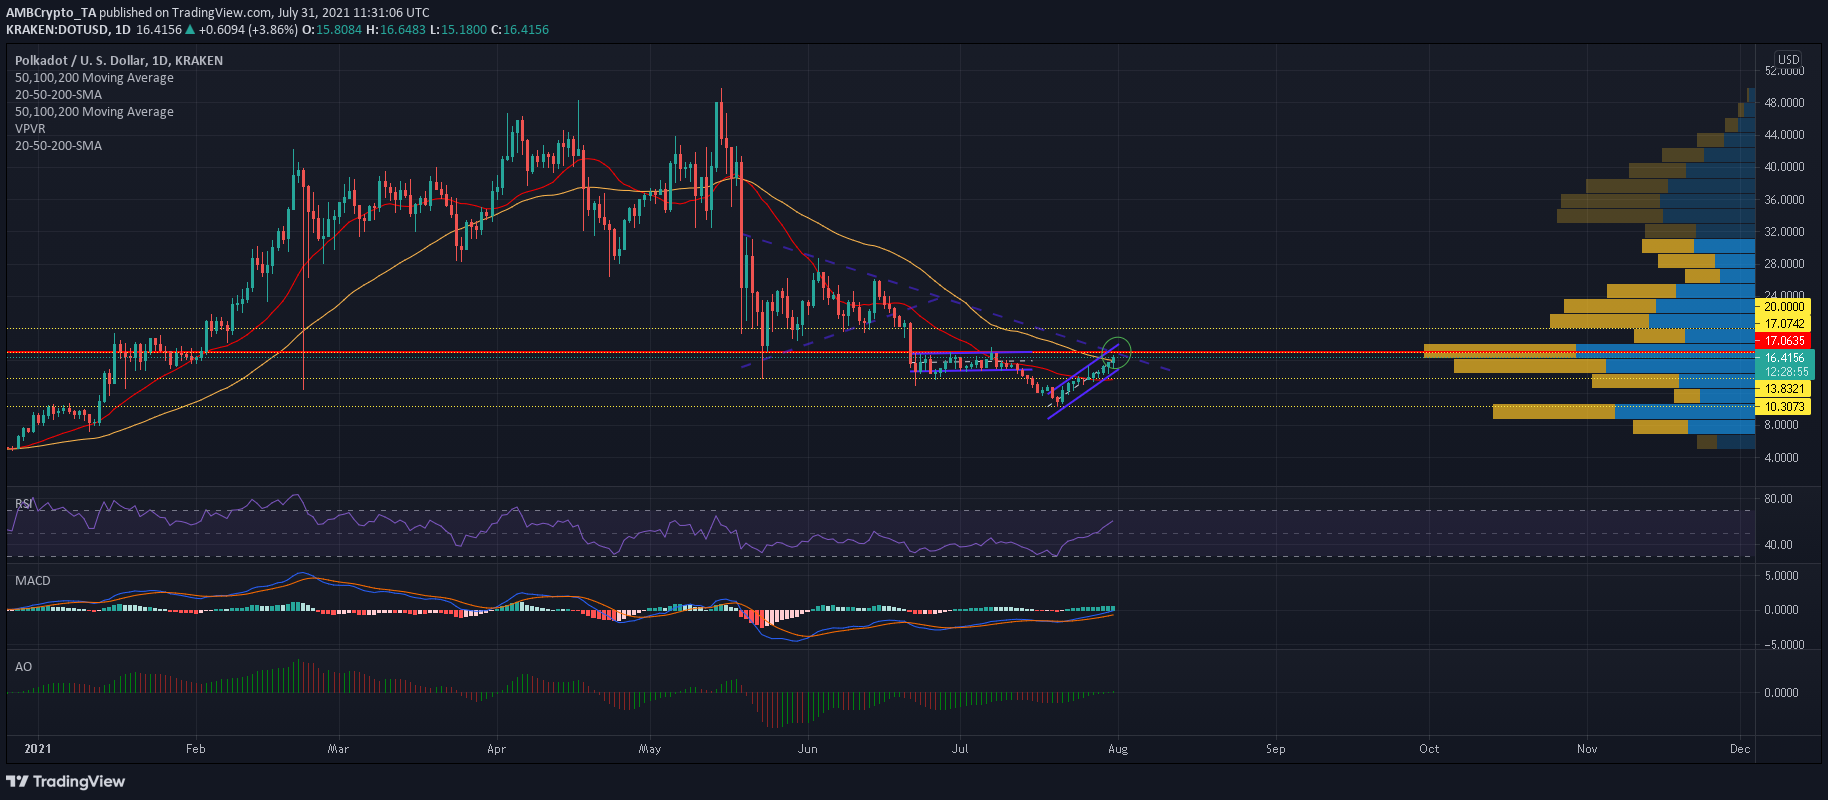
Polkadot Daily Chart
Source: DOT/USD, TradingView
Polkadot's chart highlighted several breakdowns since late-May. Its first decline was triggered when the price moved south from a symmetrical triangle, one which resulted in a 34% sell-off. The second came on the back of a horizontal channel breakdown - A move that resulted in another 30% retracement.
Its bounceback from 20 July's swing low of $10.3 resulted in an uptrend which was a breath of fresh air in the market. However, at press time, bulls were under the threat of another correction as the price approached $17. This area clashed with the Visible Range's POC. It also coincided with an upper sloping trendline that emerged post-DOT's 19 May plummet.
Hence, there seemed to be a great chance that traders would sell DOT at this level to capitalize on their long positions.
Indicators v. Resistance?
At the time of writing, DOT's indicators were lining up a bullish narrative against a strong resistance level. The Relative Strength Index rose above 50-55 for the first time in over 2 months, whereas both the Awesome Oscillator and MACD noted a hike in buying pressure.
While these were certainly positive signs, DOT needs to close above $17 to invalidate a bearish outcome. Failing to do so could result in a correction back towards 23 May's swing low of $13.8 and the 20-SMA (red).
Conclusion
DOT flashed positive signals as it approached the crucial price ceiling of $17. Unable to maintain its rise above this level over the next 24 hours might enable the next market sell-off. Traders can cash in on this move by shorting DOT at $17 and exiting their positions at $13.8. This would result in gains of 18%.
The post How Polkadot's traders can cash in on a projected retracement appeared first on AMBCrypto.
3y ago
bullish:
2
bearish:
0
Share


 Manage all your crypto, NFT and DeFi from one place
Securely connect the portfolio you’re using to start.

bullish:
0
bearish:
0

bullish:
0
bearish:
0

bullish:
0
bearish:
0

bullish:
0
bearish:
0