XRP Price Prediction: Ripple Crumbles From July Highs, Risks Exploring Levels Under $0.7
3y ago
bullish:
7
bearish:
2
Share


- XRP price failed to extend the bullish leg to $0.8 following the gains on the weekend.
- Ripple hunts for support at the 50 SMA to avert losses under $0.7.
- The MACD and the RSI reinforce the bearish outlook, leaving XRP vulnerable to losses.
Ripple price has continued with an upward roll started after July’s worst selloff that saw it plummet to $0.52. The international money transfer token seems to have restored investor interest, especially with the launch of the On-Demand Liquidity (ODL) remittance corridor between Japan and the Philippines.
The payments corridor tapping into Ripple’s flagship blockchain service is significant because of the nearly $2 billion a year remittance market between the two companies. Following this news, XRP made hastes stepping above $0.7. The bullish leg stretched toward $0.8 over the weekend but stalled around $0.78 on some exchanges like Bitfinex.
XRP Price Engages Reverse Gears At Full Throttle
Ripple is trading at $0.72 in the wake of rejection from $0.78. Since the recovery began last month, the price action shaped in an ascending parallel pattern. The channel’s upper edge contributed to the overhead pressure, cutting short XRP’s bid for $0.8 and $1.
Besides, a break under the middle boundary appears to have put bears completely in control. Hence, Ripple needs to hold the support at the 50 Simple Moving Average (SMA) and the channel’s lower boundary. This will ensure that losses do not stretch to $0.7 and explore levels further down.
XRP/USD four-hour chart
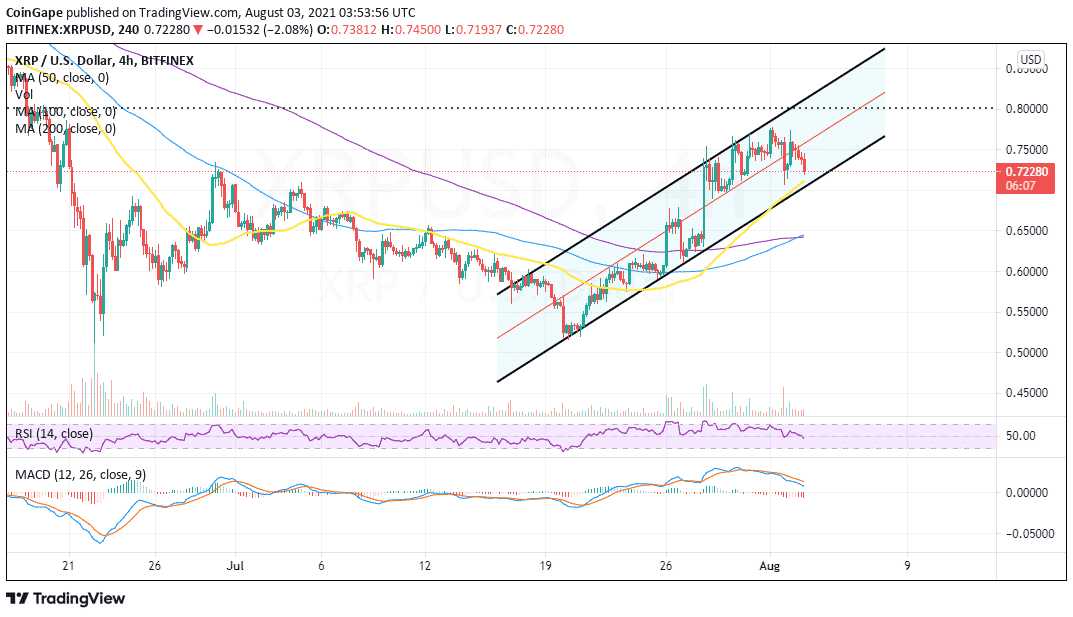
It is worth mentioning that the short-term technical picture is mainly bearish, starting with the Moving Average Convergence Divergence (MACD). A sell signal from this trend-following tool appeared when the 12-day EMA crossed below the 26-day EMA. Note that the odds for a bearish outlook soar as the MACD moves closer to the mean line.
The Relative Strength Index (RSI) adds credibility to the bearish narrative, especially with the ongoing retreat from the oversold region. Sellers will get more aggressive if the RSI confirms movement below the midline and closes the gap to the oversold area.
Ripple Price Intraday Levels
Spot rate: $0.722
Trend: Bearish
Volatility: Expanding
Support: The 50 SMA and $0.7
Resistance: $0.75 and $0.78
The post XRP Price Prediction: Ripple Crumbles From July Highs, Risks Exploring Levels Under $0.7 appeared first on Coingape.
3y ago
bullish:
7
bearish:
2
Share


 Manage all your crypto, NFT and DeFi from one place
Securely connect the portfolio you’re using to start.

bullish:
0
bearish:
0

bullish:
0
bearish:
1

bullish:
0
bearish:
0

bullish:
1
bearish:
0