Markets Start Session on Bear Activity as Bitcoin Gold Dominates
9M ago•

bullish:
1
bearish:
0
Share

Markets have started today on bear activity, with the global market cap recording a 2% decrease in a day to take the total cap to $1.16T as of press time. The fear and greed index is also at 51, indicating a neutral position.
Bitcoin (BTC) analysis
Bitcoin (BTC) is encountering some bear activity as the asset faces new resistance at $29K and is now trading at $28.9K after recording a daily drop of 1.7%, as the weekly decrease now stands at 0.77%. However, Bitcoin trade volume has jumped by 25% during the same period and is presently at $13B.
The Bollinger bands, moving close to each other, are now slowly diverging, indicating that the volatility of Bitcoin is increasing. However, the Relative Strength Index (RSI) is moving below its average level, showing the struggle between bulls and bears for market dominance.

Ethereum (ETH) analysis
Ethereum (ETH) has also started today slowly, as the asset now sits on mild losses of 1.9% within a day of trading to take it to $1830 as the trading volume dropped by 20% to take it to $5.5B as of press time. ETH’s volatility levels are also low as the Bollinger bands remain relatively close.
The RSI indicator is still below its average, indicating a likely bearish trend on Ethereum as the asset’s bears continue to push for market dominance. The MACD indicator also moves below in the negative region, showing the effort by bears to dominate markets.

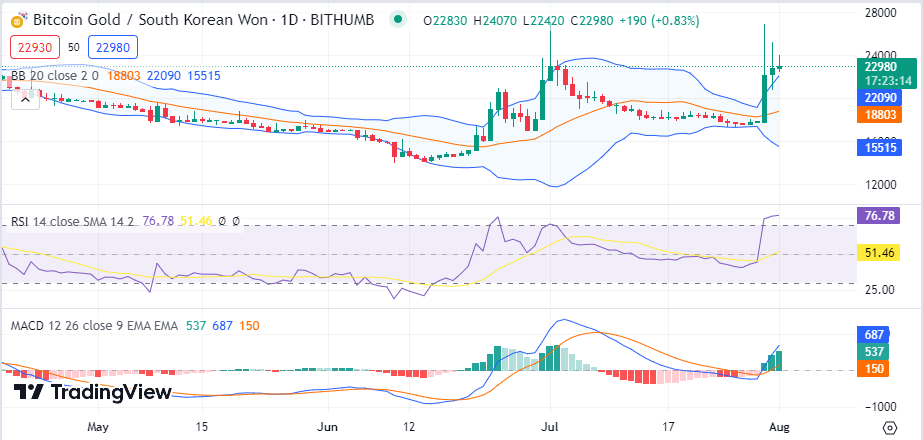
Bitcoin Gold (BTG) analysis
BTG also has a tremendous session as the asset trades 11% above its previous 24-hour price. The weekly gain now stands at 38% as the asset trades at $18.35 as of press time. However, BTG’s trading volume has dropped by 15%, now at $192M.
However, BTG’s volatility levels are high as the Bollinger bands diverge from each other, indicating increasing volatility levels as the RSI moves above the average line in the overbought region as the MACD also moves in the green zone.
Optimism (OP) analysis
OP is having a corrective session today as the asset trades 5.7% below its previous 24-hour price. The weekly gain currently stands at 7.8%, as the asset’s spot price currently stands at $1.59.
OP’s trading volume has seen a 1% surge within a day of trade to reach $230M as of press time, while the market cap stood at $230M. OP’s volatility levels are relatively low as the Bollinger bands move toward each other. At the same time, the RSI shifts to the negative region, showing bear dominance in today’s session, while the MACD also approaches a shift to the negative zone.

Other analysis
Verge (XVG) is also making trends today as the asset trades 6.6% below its previous 24-hour price. The asset now trades at $0.004804, with XBOT (XBOT) also making trends with massive gains of 58% in a day as the asset now trades at $0.000000000001. Bald (BALD) is also making trends with huge losses of 70% daily as it trades at $0.006164.
9M ago•
bullish:
1
bearish:
0
Share


 Manage all your crypto, NFT and DeFi from one place
Securely connect the portfolio you’re using to start.

bullish:
1
bearish:
0

bullish:
1
bearish:
0

bullish:
0
bearish:
1

bullish:
1
bearish:
0