Crypto Market Price Analysis Today: Bitcoin (BTC), Ethereum (ETH), Golem (GLM), aelf (ELF), Solana (SOL)
12d ago•

bullish:
0
bearish:
0
Share

Bitcoin remains within a broad trading range, reflecting uncertainty about its next major move. Analysts are excited by the transfer of $1.3 billion in USD Coin to Coinbase by large holders, anticipating that these funds will be used to purchase Bitcoin and Ether.
It’s not just Bitcoin and Ethereum attracting significant investment. CoinShares’ head of research, James Butterfill, noted in a recent report that 15% of surveyed institutional investors have invested in Solana, a notable increase from none in January.
Mark Yusko, CEO of Morgan Creek Capital, discussed in an interview on The Wolf Of All Streets podcast that approximately $300 billion from baby boomers’ wealth is expected to flow into digital assets within the next year. This influx could potentially raise the total cryptocurrency market capitalization to $6 trillion.
Will buyers be able to prevent bears from further driving down the price in Bitcoin and other cryptocurrencies? Let’s delve into the charts of the top 5 cryptocurrencies to discover more.
Bitcoin (BTC) Price Analysis
Recently, Bitcoin has been trading beneath its moving averages, but there has not been a significant drop to the key support level at $61K, indicating a reduction in selling pressure at lower prices. As of writing, *BTC* price trades at $63,012, declining over 1.2% in the last 24 hours.
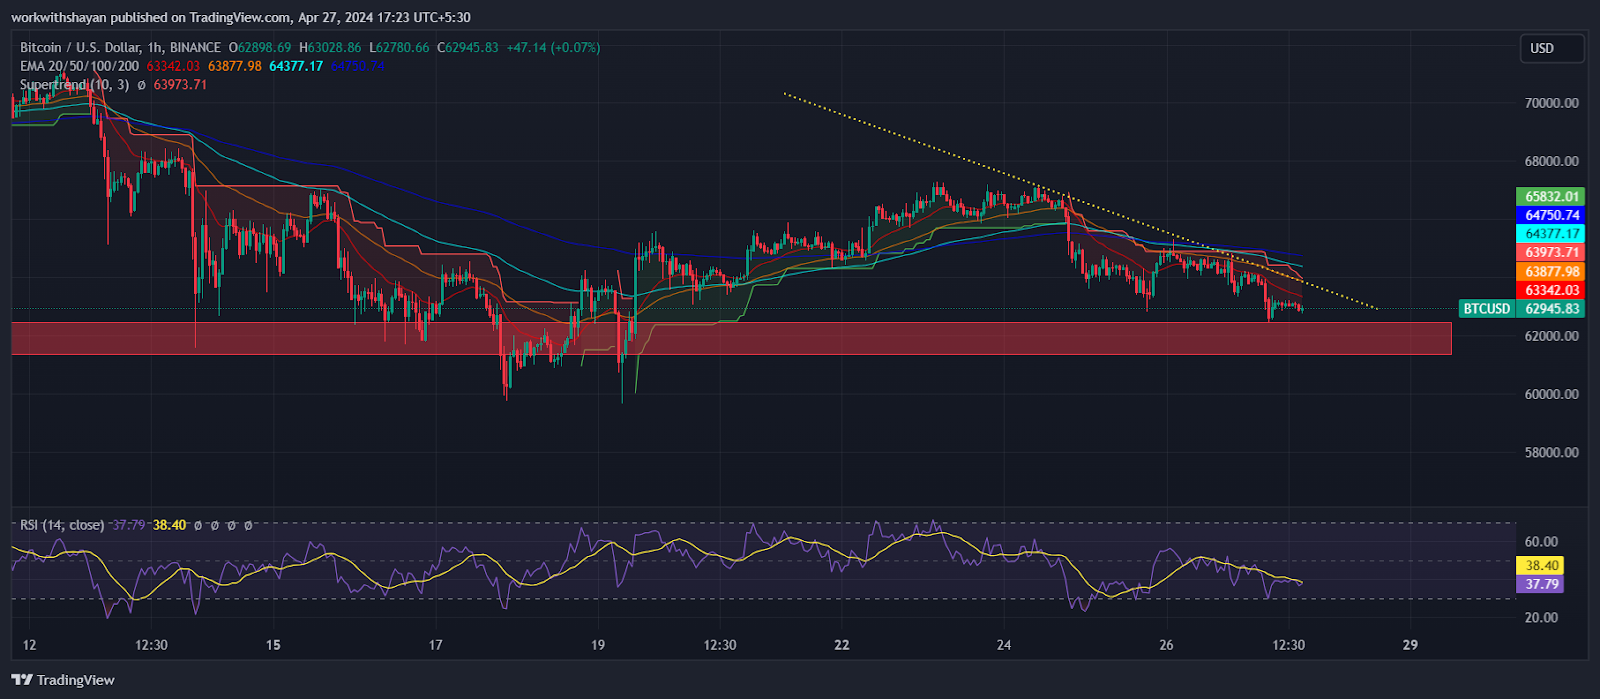
BTC/USDT Chart On TradingView
Currently, the price is oscillating between the 50-day simple moving average at $65,404 and the important support at $60,775. The 20-day exponential moving average at $63,385 is beginning to decline, and the relative strength index (RSI) is below the midpoint, slightly favoring the bears.
If the price decisively falls below $61K, it could trigger a decline towards the 61.8% Fibonacci retracement level at $59,484.
Conversely, if the price can ascend past the 50-day SMA, this bearish outlook would be invalidated in the short term. The BTC/USDT pair might then rise to $73,777, challenging the critical resistance level that bulls need to breach.
Ethereum (ETH) Price Analysis
Ether has been fluctuating within a narrow range, trading between the 20-day EMA ($3,124) and the support level at $3,056 over recent days. Sellers are strongly defending a surge above the immediate Fib channel. As of writing, *ETH* price trades at $3,118, declining over 0.3% in the last 24 hours.
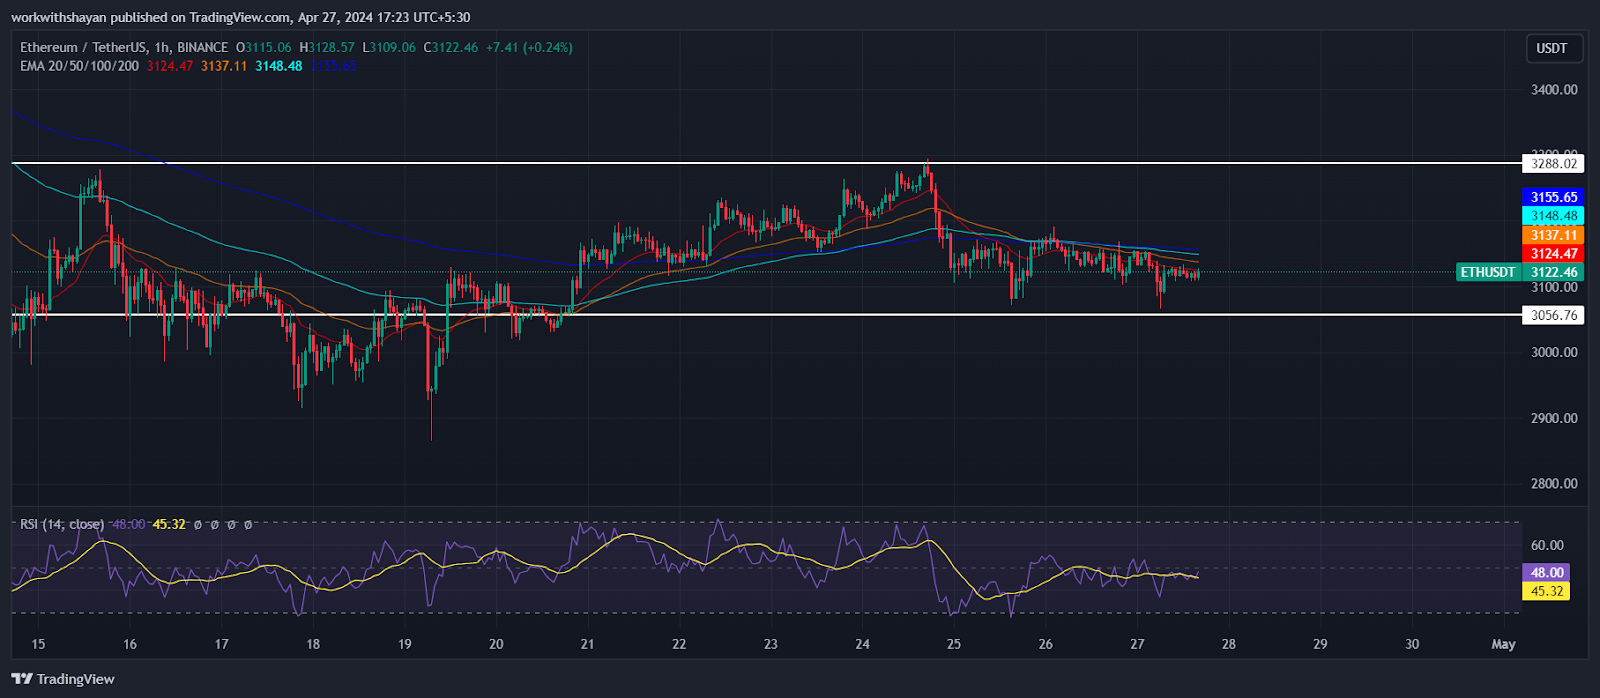
ETH/USDT Chart On TradingView
This period of limited movement is expected to end soon. A break above the 20-day EMA could propel the ETH/USDT pair towards the 50-day SMA ($3,300), which might temporarily hinder further gains, though a breach is anticipated. Subsequently, the pair could ascend to $3,679.
On the other hand, a downturn that pushes the price below $3,056 would indicate that bearish forces have taken control. This could lead to a retest of the vital support at $2,852. A further drop below this point could drive the price down to $2,700.
Golem (GLM) Price Analysis
GLM has finally made a strong breakout after consolidating around the $0.39 mark. Buyers continued to break above resistance channels and are now aiming for a new higher high in the coming hours. As of writing, GLM price trades at $0.53, surging over 40% in the last 24 hours.
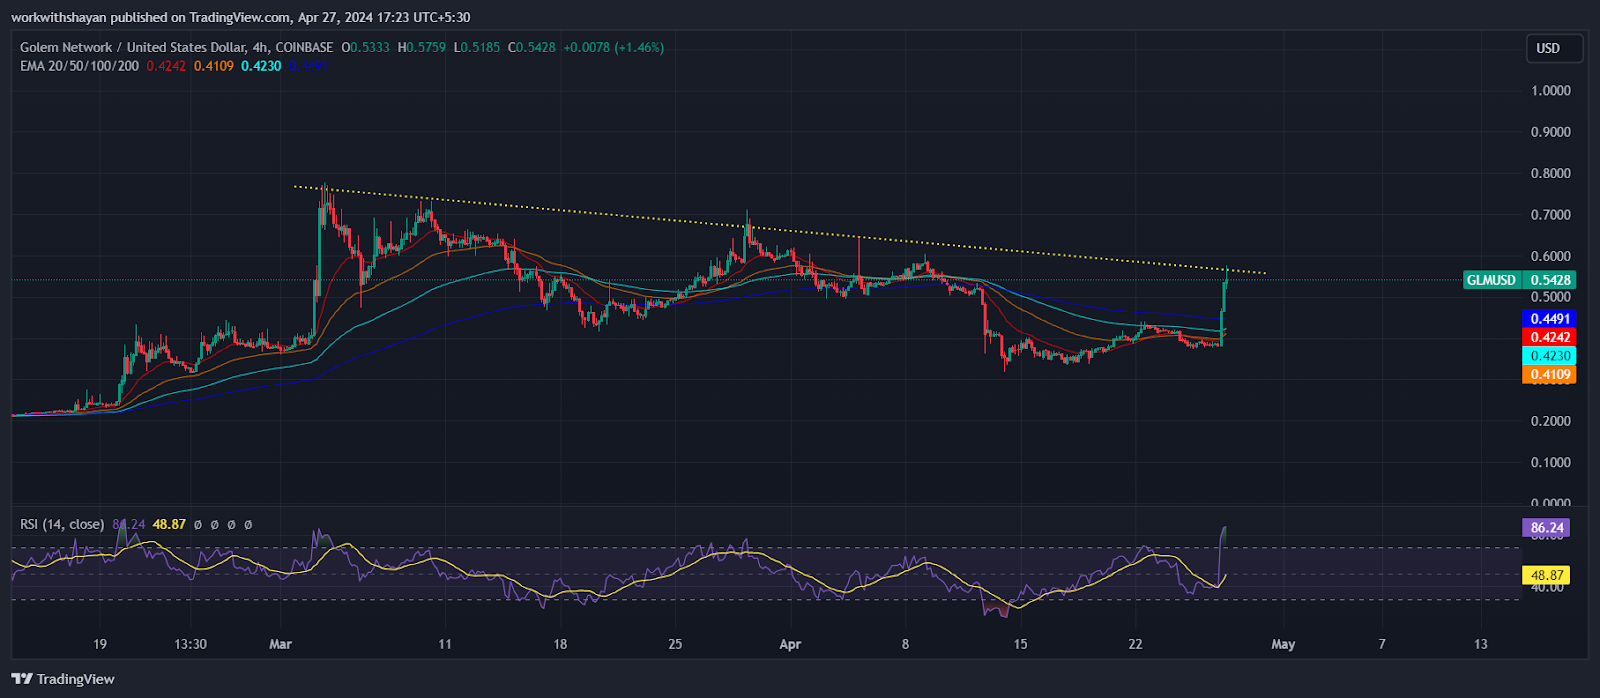
GLM/USDT Chart On TradingView
Nonetheless, it is encouraging to see that the bulls remain engaged rather than exiting at higher levels. The price might retreat to the moving averages in the short term, which are expected to provide support. A strong rebound from these averages could increase the likelihood of breaking above $0.57. If achieved, the GLM/USDT pair could rise to $0.64 and potentially reach the target of $0.76.
Conversely, if the price falls below the moving averages, it suggests that buyers are in a selling mode.
aelf (ELF) Price Analysis
ELF price is currently trading around its 20-day Exponential Moving Average (EMA) at $0.62, with bulls seeking stability at the uptrend line. The price surged and touched a high of $0.67, where bears put up a strong defense. As of writing, ELF price trades at $0.635, surging over 9% in the last 24 hours.
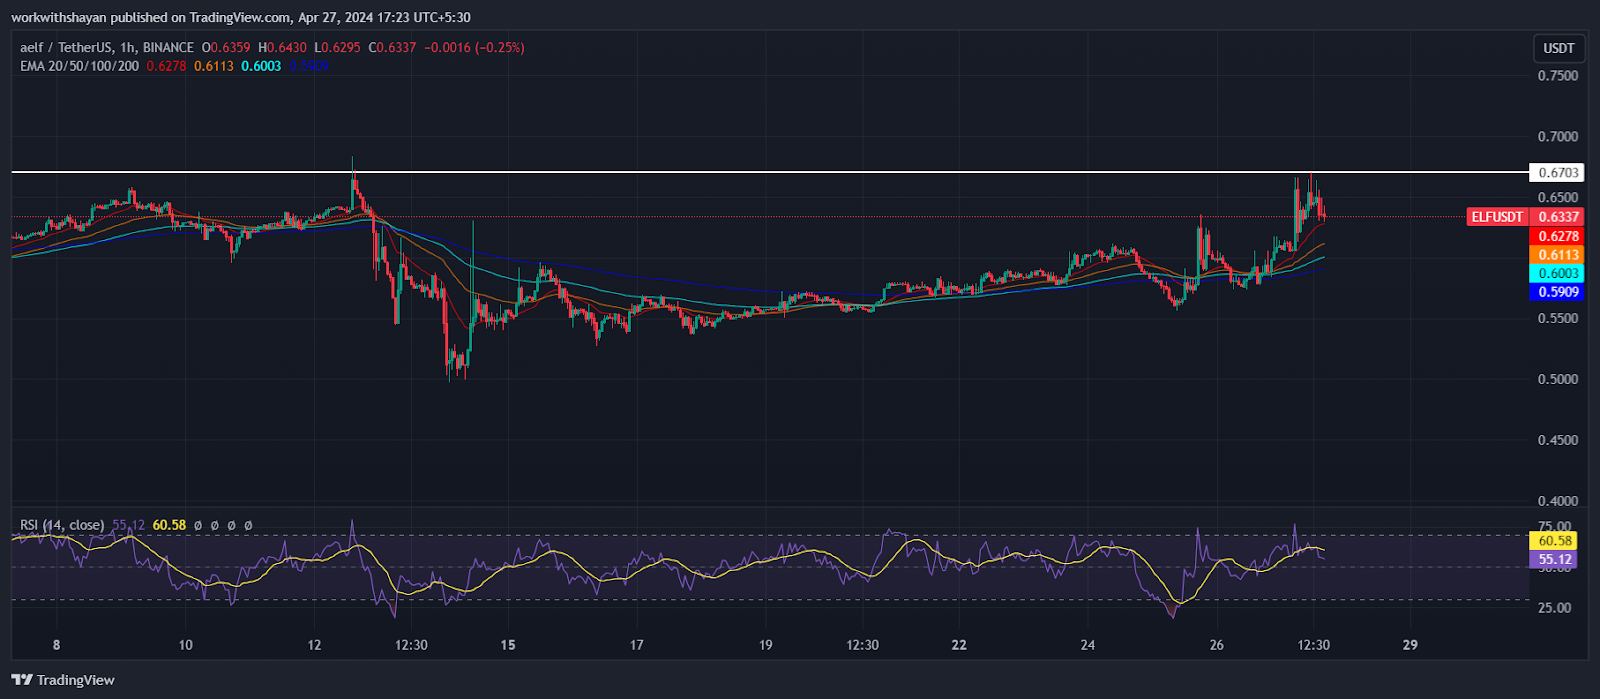
ELF/USDT Chart On TradingView
Should the price rebound from the current level and surpass $0.67, it would indicate a weakening of bearish momentum. In this scenario, the ELF/USDT pair might aim for a rise to the 50-day Simple Moving Average (SMA) at $0.73, and potentially advance to $0.77.
Conversely, if the price declines further and falls beneath the moving averages, it would signal that bears are dominating the market. The pair could then drop to $0.55, where strong support from the bulls is anticipated.
Solana (SOL) Price Analysis
Solana was rejected at the overhead resistance of $145 on April 27, suggesting bearish activity at higher price levels. This has resulted in a plunge toward the low of $130; however, buyers are currently consolidating the price. As of writing, *SOL* price trades at $136, declining over 4% in the last 24 hours.
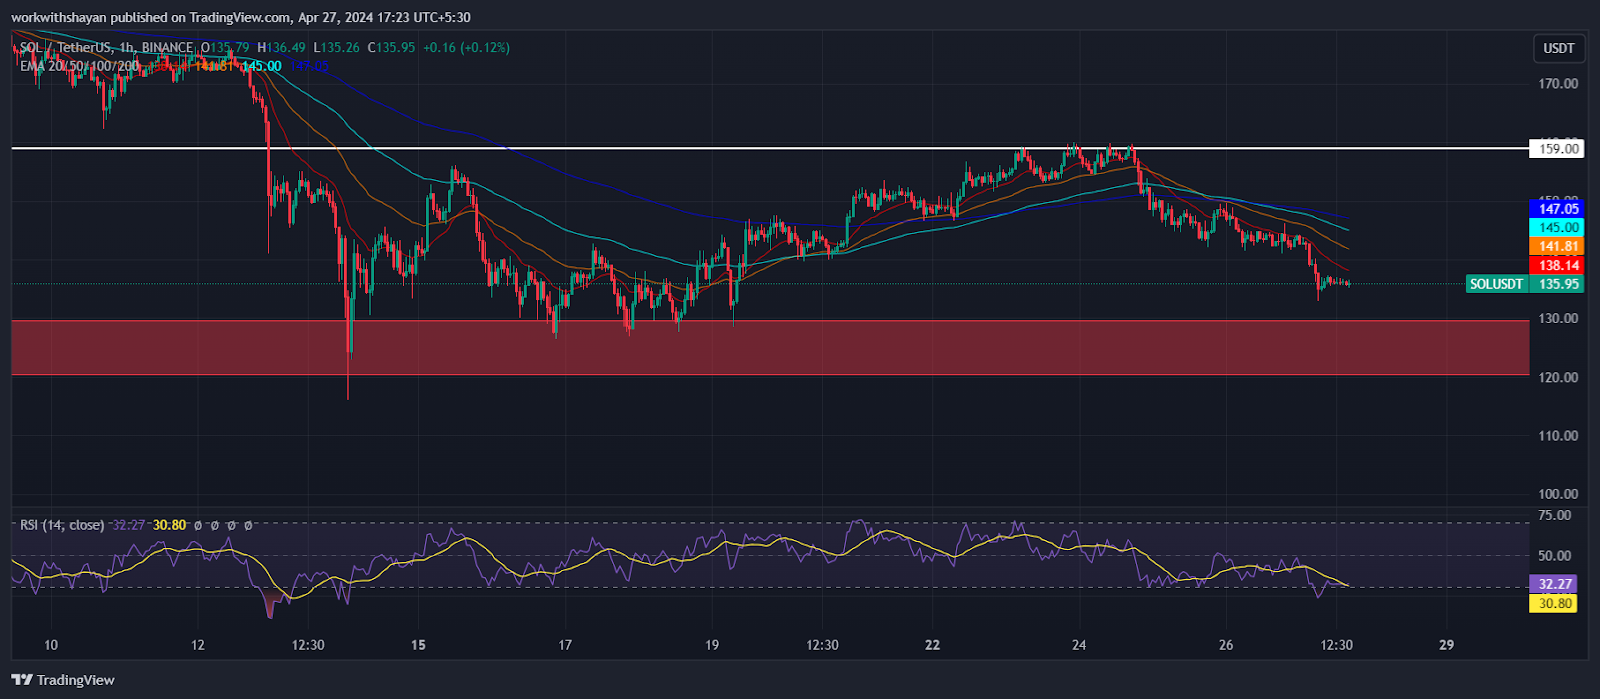
SOL/USDT Chart On TradingView
The 20-day EMA ($138) is gradually declining, and the RSI is in the negative territory, indicating a bearish advantage. The SOL/USDT pair might retreat towards the robust support at $126. A strong bounce from this level would suggest a potential consolidation between $126 and $162.
A bullish signal would emerge with a breakout and close above the 50-day SMA ($159), potentially paving the way for a rally towards $205. Conversely, a breach below $126 could drive the pair towards $100.
12d ago•
bullish:
0
bearish:
0
Share


 Manage all your crypto, NFT and DeFi from one place
Securely connect the portfolio you’re using to start.

bullish:
0
bearish:
0


bullish:
0
bearish:
0

bullish:
0
bearish:
0