3 Bullish Bitcoin Cues – Why BTC Is Gonna Rock 2024, Despite Today’s Plunge
22d ago•

bullish:
0
bearish:
0
Share

NOIDA (CoinChapter.com)—On May 10, BTC price dropped below $61,000 after the token’s price fell nearly 4% to reach a daily low of $60,250, but we’re going to look at the 3 bullish Bitcoin cues developing right now. These indicators could help the prime crypto token’s price register some gains in the near future.
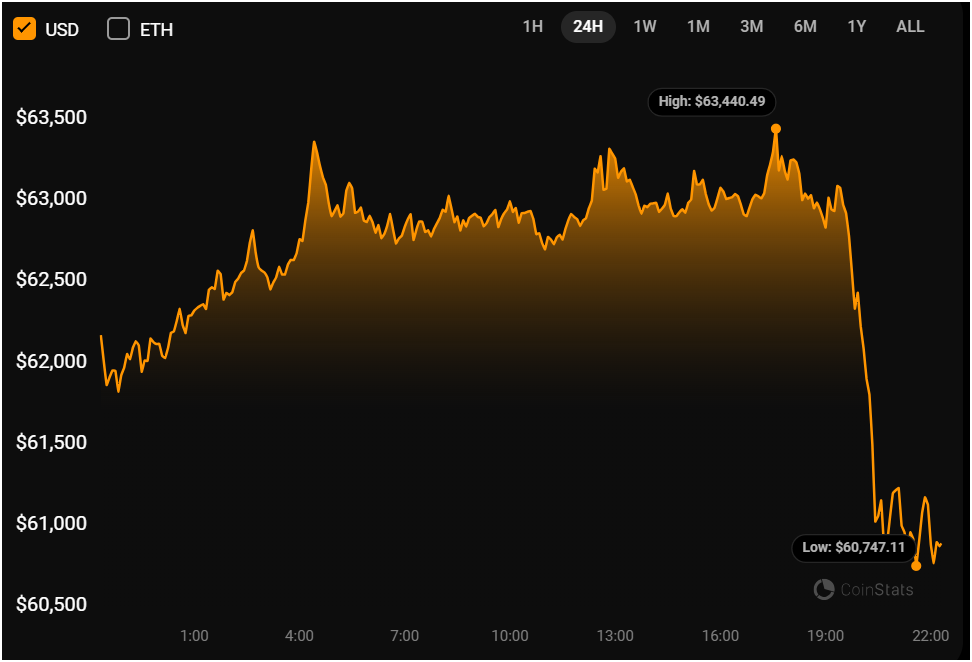
Bitcoin price suddenly dropped on May 10, indicating the token remains susceptible to sudden market movements.
Meanwhile, Jack Dorsey, Twitter founder and ex-CEO, predicted a price target of more than $1 million for Bitcoin. However, before everyone gets excited, Dorsey’s BTC price target is for 2030. For the moment, BTC price has bullish cues coming from technical setups and on-chain metrics. Let’s take a look at those top 3 bullish Bitcoin cues.
1. BTC Moving Inside Bullish Pattern
Bitcoin price has formed a bullish technical pattern called the ‘falling wedge.’
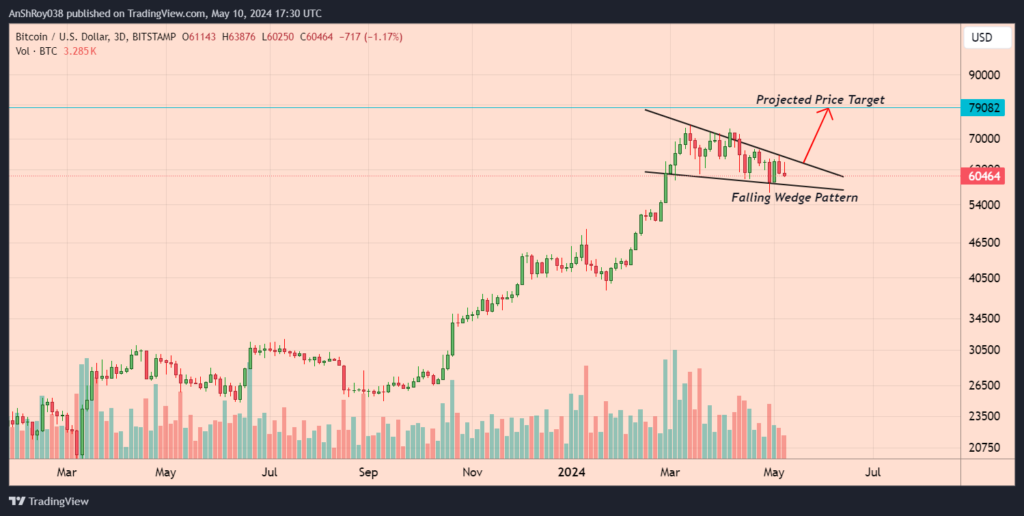
A falling wedge pattern features a pair of converging trend lines connecting lower highs and lower lows, forming a narrowing shape that slopes downward.
The pattern typically suggests that an asset’s price, while consolidating in a downtrend, is losing bearish momentum and preparing for a potential reversal to the upside. Typically, a breakout occurs in the direction of the overall trend, which, for a falling wedge, is upward.
To estimate the price target of a falling wedge pattern, traders measure the widest part of the wedge at the beginning of the formation. They then project this distance upward from the point of the breakout to set a potential target.
An accompanying increase in trading volume can further confirm the reliability of the breakout. Higher volume during the breakout suggests stronger market conviction, supporting the likelihood of a successful price reversal.
According to the rules of technical analysis, the SOL price could rally over 31% to reach the pattern’s theoretical price target near $79,100.
2. Net Unrealized Profit/Loss (NUPL) Bullish For Bitcoin
Bitcoin’s Net Unrealized Profit/Loss (NUPL) has recently surpassed 0.5, a critical threshold that signals robust market optimism. The indicator measures the ratio of unrealized profit to the market cap, suggesting that the majority of Bitcoin holders are in a state of significant unrealized profit.
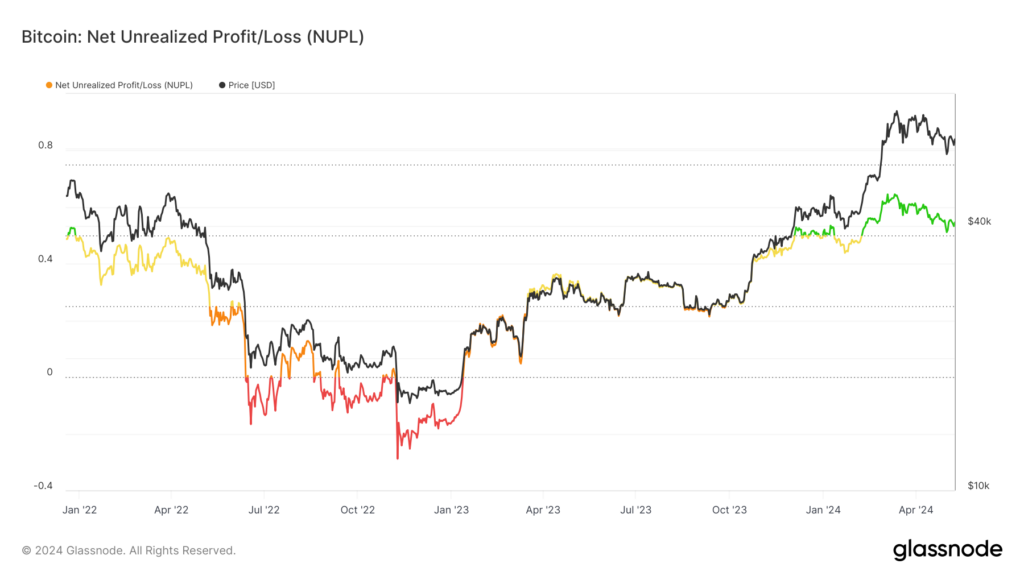
Typically, a NUPL value above 0.5 marks the entry into a ‘euphoria’ phase, historically associated with strong upward price movements. The breach of this level indicates that investors are holding onto their coins in anticipation of higher prices, reflecting a bullish sentiment across the market.
Furthermore, the psychological state among investors can lead to a self-reinforcing positive price action as more participants enter the market to capitalize on the momentum.
3. Short-Term Holder Cost Basis Another Bullish On-Chain Metric
Another critical indicator providing bullish signals is the Short-Term Holder Cost Basis. Following the initial post-halving dip, Bitcoin prices found strong support at this level.
The metric represents the average acquisition price of Bitcoin by investors who have held their coins for less than 155 days. During bullish phases, this price level acts as significant psychological and technical support, indicating that recent buyers are unwilling to sell at a loss, thereby stabilizing prices.

The rebound from this cost basis level suggests that new market entrants are confident in the asset’s value, supporting ongoing upward trends. When prices hold above this cost basis, it typically prevents deeper sell-offs and encourages more speculative buying, further fueling the rally.
The combination of a high NUPL value and robust support at the Short-Term Holder Cost Basis paints a compelling picture of Bitcoin’s current market dynamics. These indicators not only reflect a healthy demand for Bitcoin but also suggest that the market structure is poised for continued growth.
As long-term holders show no sign of significant selling pressure and new investors step in at higher price levels, Bitcoin’s path ahead looks promisingly bullish.
The post 3 Bullish Bitcoin Cues – Why BTC Is Gonna Rock 2024, Despite Today’s Plunge appeared first on CoinChapter.
22d ago•
bullish:
0
bearish:
0
Share

 Manage all your crypto, NFT and DeFi from one place
Securely connect the portfolio you’re using to start.

bullish:
0
bearish:
0

bullish:
0
bearish:
0

bullish:
0
bearish:
0
